

Question: Please show ALL steps and explanations in MATLAB 2 a) Create an m-file to compute the value of the function: y= e(-22%) cos(4tex - 1.5)
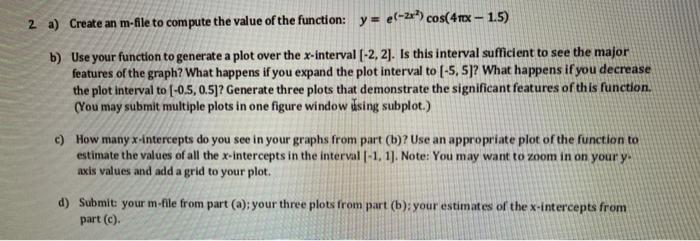
2 a) Create an m-file to compute the value of the function: y= e(-22%) cos(4tex - 1.5) b) Use your function to generate a plot over the x-interval [-2, 2). Is this interval sufficient to see the major features of the graph? What happens if you expand the plot interval to (-5,5)? What happens if you decrease the plot interval to (-0.5, 0.5]? Generate three plots that demonstrate the significant features of this function. (You may submit multiple plots in one figure window Asing subplot.) c) How many x-intercepts do you see in your graphs from part (b)? Use an appropriate plot of the function to estimate the values of all the x-intercepts in the interval -1, 1). Note: You may want to zoom in on your y. axis values and add a grid to your plot. d) Submit your m-file from part (@)your three plots from part (b): your estimates of the x-intercepts from part (c)
Step by Step Solution
There are 3 Steps involved in it

Get step-by-step solutions from verified subject matter experts