

Question: PLEASE SHOW ALL STEPS FOR ME TO BE ABLE TO LEARN THE PROCESS AND UNDERSTAND Table below shows results for it} selected students on Test-1
PLEASE SHOW ALL STEPS FOR ME TO BE ABLE TO LEARN THE PROCESS AND UNDERSTAND
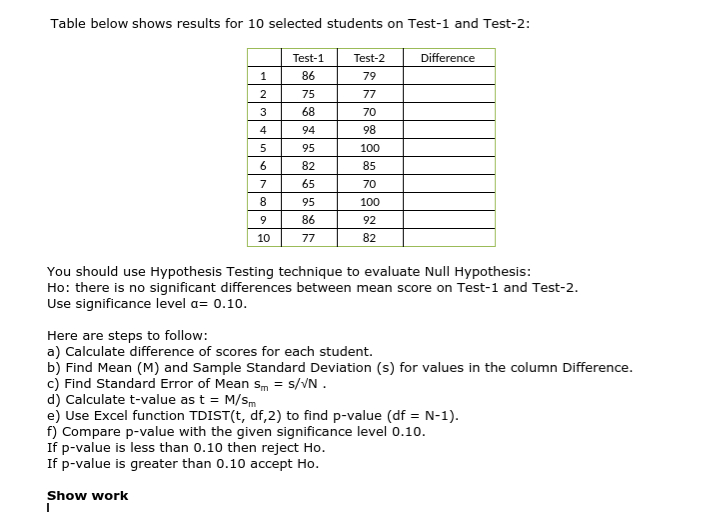
Table below shows results for it} selected students on Test-1 and Test-2: You should use Hypothesis Testing technique to evaluate Null vaothesis: Ho: there is no signicant differences between mean score on Test1 and Test2. Use signicance level n: (1.1(1. Here are steps to follow: a) Calculate difference of scores for each student. b] Find Mean {M} and Sample Standard Deviation {s} for values in the column Difference. c} Find Standard Error of Mean sm = sHN . d] Calculate t-value as t = Mfsm e} Use Excel function TDIST[t, df,2] to nd p-value {df = Iii-1]. f} Compare pvalue with the given signicance level 13.10. If pvalue is less than (1.10 then reject Ho. If p-value is greater than D.l acoept Ho. Show work I
Step by Step Solution
There are 3 Steps involved in it

Get step-by-step solutions from verified subject matter experts