

Question: PLEASE SHOW ALL STEPS TO LEARN THE PROCESS AND TO BE ABLE TO UNDERSTAND Table below shows number of students who failed different math courses
PLEASE SHOW ALL STEPS TO LEARN THE PROCESS AND TO BE ABLE TO UNDERSTAND
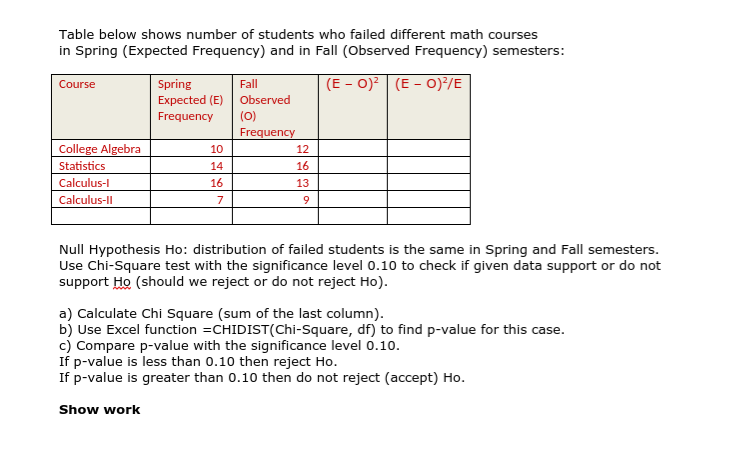
Table below shows number of students who failed different math courses in Spring {Expected Frequency} and in Fall {Observed Frequency} semesters: College Atgehra m_ Statistics \"-5 Ct-FtuIUt-I -E_ Cattulus-II Null Hypothesis Ho: distribution of failed students is the same in Spring and Fall semesters. Use Chi-Square test with the signicance level .1 to check if given data support or do not support {jig {should we reject or do not reject Ho}. a} Calculate Chi Square {sum of the last column}. b] Use Excel Function =CHIDIST{Chi-Square, d to nd p-value for this case. c} Compare p-value with the signicance level 0.10. If p-value is less than (1.10 then reject Ho. If p-value is greater than 0.1(1 then do not reject {accept} Ho. Show work
Step by Step Solution
There are 3 Steps involved in it

Get step-by-step solutions from verified subject matter experts