

Question: 1. Create a codebook. 2. Enter all data below into an SPSS file. 3. Conduct univariate analysis on all variables and report the appropriate
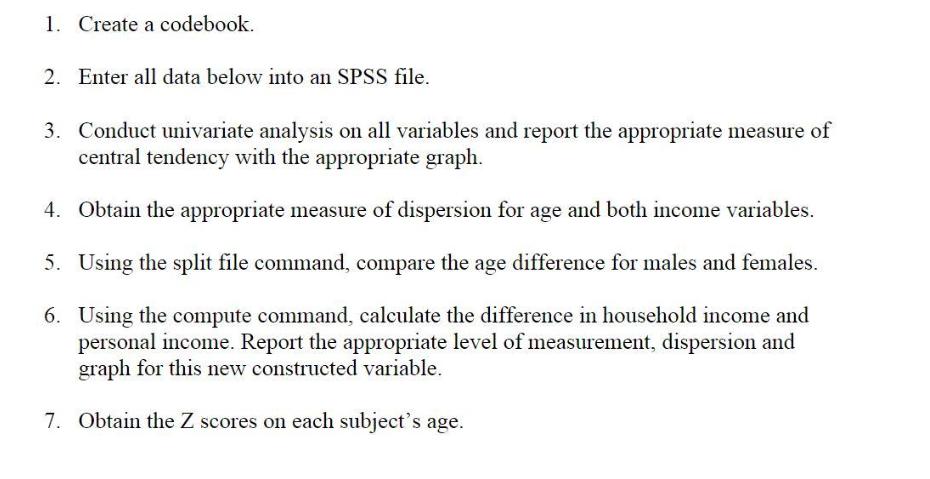
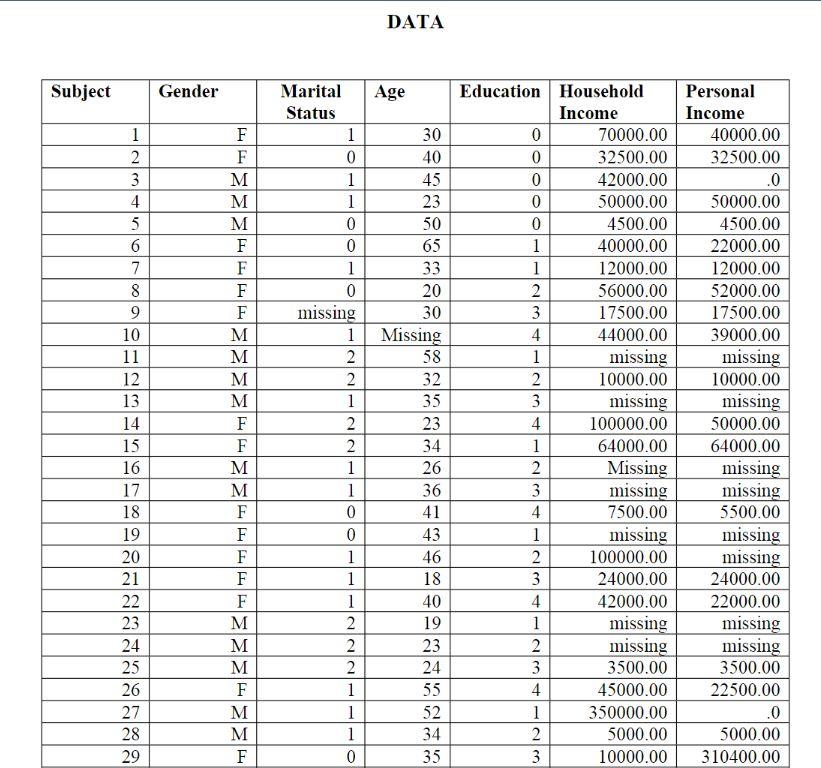
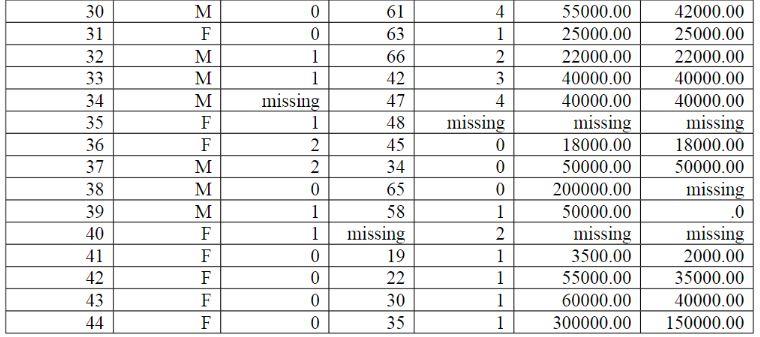
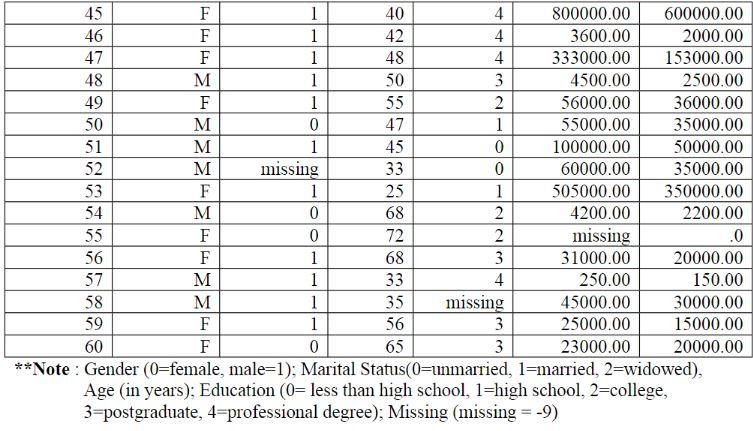
1. Create a codebook. 2. Enter all data below into an SPSS file. 3. Conduct univariate analysis on all variables and report the appropriate measure of central tendency with the appropriate graph. 4. Obtain the appropriate measure of dispersion for age and both income variables. 5. Using the split file command, compare the age difference for males and females. 6. Using the compute command, calculate the difference in household income and personal income. Report the appropriate level of measurement, dispersion and graph for this new constructed variable. 7. Obtain the Z scores on each subject's age. Subject 1 2 3 4 5 6 7 8 9 10 11 12 13 14 15 16 17 18 19 20 21 22 23 24 28282 25 26 27 29 Gender F F M M M FFE F M M M M F F M M F F F F F M M M F M M F Marital Age Status 1 0 1 1 0 0 1 0 missing 1 2 2 1 22 1 1 0 0 1 1 1 2 2 2 1 1 1 DATA 0 30 40 45 23 50 65 33 20 30 Missing 58 32 35 23 34 26 36 41 43 46 18 40 19 23 24 55 52 34 35 Education Household Income 0 0 0 0 0 1 1 2 3 4 1 2 3 4 1 2 3 4 1 2 3 4 1 2 3 4 1 2 3 70000.00 32500.00 42000.00 50000.00 4500.00 40000.00 12000.00 56000.00 17500.00 44000.00 missing 10000.00 missing 100000.00 64000.00 Missing missing 7500.00 missing 100000.00 24000.00 42000.00 missing missing 3500.00 45000.00 350000.00 5000.00 10000.00 Personal Income 40000.00 32500.00 .0 50000.00 4500.00 22000.00 12000.00 52000.00 17500.00 39000.00 missing 10000.00 missing 50000.00 64000.00 missing missing 5500.00 missing missing 24000.00 22000.00 missing missing 3500.00 22500.00 .0 5000.00 310400.00 30 31 32 33 34 35 36 37 38 39 40 41 42 43 44 M F M M M F F M M M F F FFE 0 0 1 1 missing 1 2 2 0 1 1 0 0 0 0 61 63 66 42 4 1 65 58 missing 19 22 30 35 2 3 4 47 48 missing 45 34 0 0 0 1 2 1 1 1 1 55000.00 25000.00 22000.00 40000.00 40000.00 missing 18000.00 50000.00 200000.00 50000.00 missing 3500.00 55000.00 60000.00 300000.00 42000.00 25000.00 22000.00 40000.00 40000.00 missing 18000.00 50000.00 missing .0 missing 2000.00 35000.00 40000.00 150000.00 45 46 47 48 49 50 51 52 53 54 55 56 57 58 59 60 F FE F F M F M M M F M F F M M F F 1 1 1 1 1 0 1 missing 1 0 0 1 1 1 1 0 40 42 48 50 55 47 45 33 25 68 72 68 33 35 56 65 4 4 4 3 2 1 0 0 1 2 2 3 4 missing 3 3 800000.00 3600.00 333000.00 4500.00 56000.00 55000.00 100000.00 60000.00 505000.00 4200.00 missing 31000.00 250.00 45000.00 25000.00 23000.00 600000.00 2000.00 153000.00 2500.00 36000.00 35000.00 50000.00 35000.00 350000.00 2200.00 .0 20000.00 150.00 30000.00 15000.00 20000.00 **Note: Gender (0=female, male=1); Marital Status(0=unmarried, 1-married, 2=widowed). Age (in years); Education (0= less than high school, 1-high school, 2-college, 3-postgraduate, 4=professional degree); Missing (missing = -9)
Step by Step Solution
3.35 Rating (155 Votes )
There are 3 Steps involved in it
Note to the Instructor The data set used in this exercise is gss14subsetforclassesSTATISTICSsav whic... View full answer

Get step-by-step solutions from verified subject matter experts