

Question: {Please show all steps. Write neat. clear and organized for partial points.) 1. Determine whether the variables are qualitative or quantitative: a] Numberof windows on
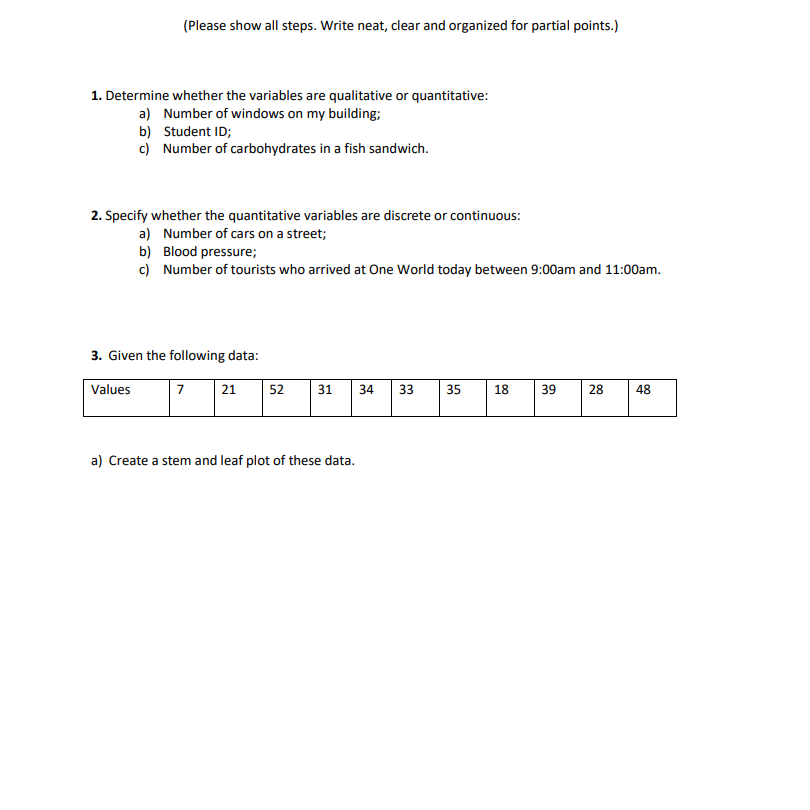
![points.) 1. Determine whether the variables are qualitative or quantitative: a] Numberof](https://s3.amazonaws.com/si.experts.images/answers/2024/06/6668508060430_384666850804d024.jpg)
![windows on my building; b} Student ID; C] Number of carbohydrates 'In](https://s3.amazonaws.com/si.experts.images/answers/2024/06/666850809d88e_384666850808cd8e.jpg)
![continuous: a] Number ofoars onastreet; b} Blood pressure; c} Number of tourists](https://s3.amazonaws.com/si.experts.images/answers/2024/06/666850816cad0_3856668508153e9b.jpg)
![39 28 43 3] Create a stem and leaf plot of these](https://s3.amazonaws.com/si.experts.images/answers/2024/06/66685082626ed_3866668508253331.jpg)
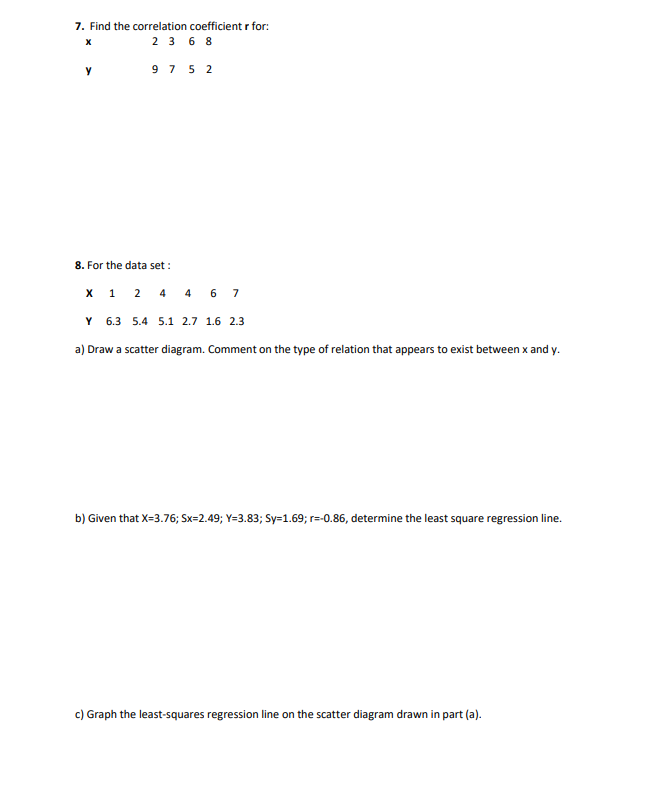
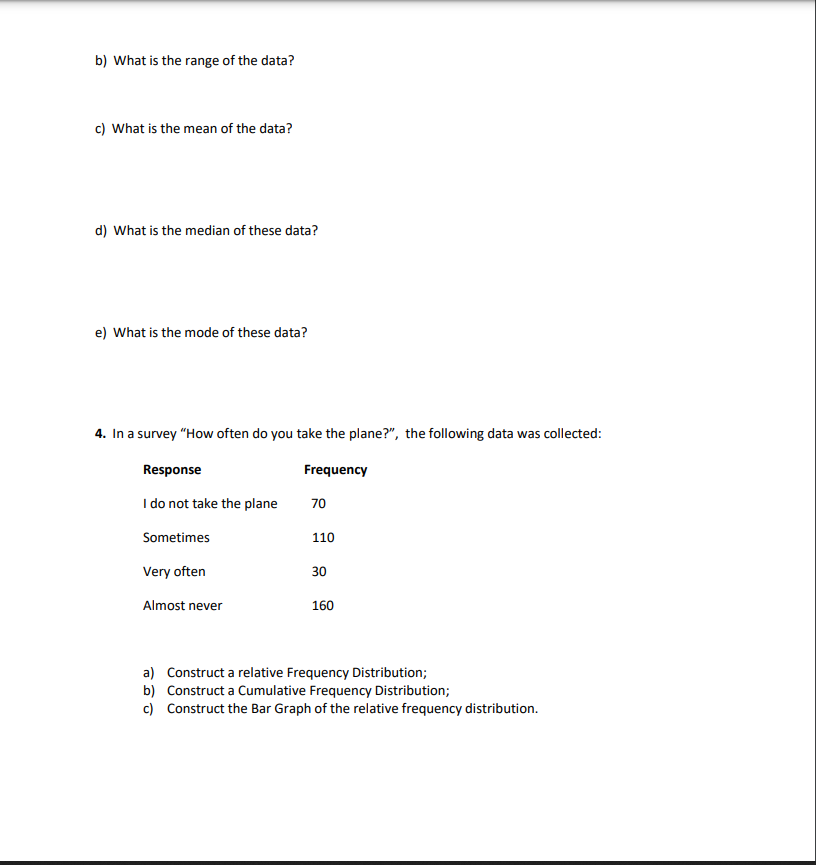
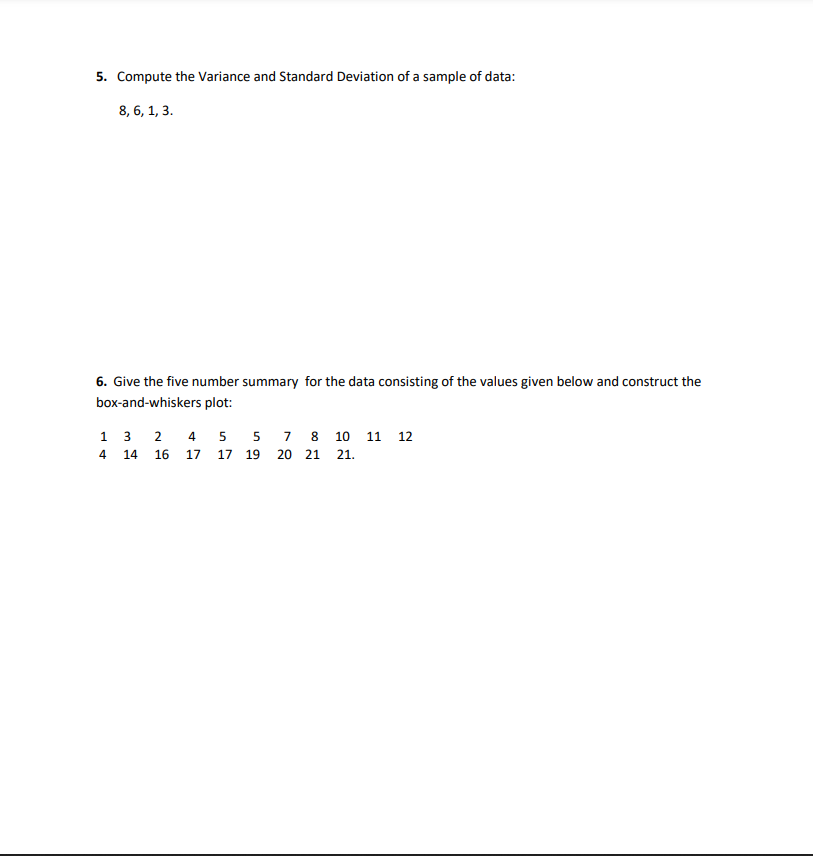
{Please show all steps. Write neat. clear and organized for partial points.) 1. Determine whether the variables are qualitative or quantitative: a] Numberof windows on my building; b} Student ID; C] Number of carbohydrates 'In a fish sandwich. 2. Specify whether the quantitative variables are discrete or continuous: a] Number ofoars onastreet; b} Blood pressure; c} Number of tourists who arrived at One World today between 9:00am and 11:00am. 3. Given the following data: Values 7 21 52 31 34 33 35 1a 39 28 43 3] Create a stem and leaf plot of these data. b) What is the range of the data? c) What is the mean of the data? d) What is the median of these data? e) What is the mode of these data? 4. In a survey "How often do you take the plane?", the following data was collected: Response Frequency I do not take the plane 70 Sometimes 110 Very often 30 Almost never 160 a) Construct a relative Frequency Distribution; b) Construct a Cumulative Frequency Distribution; c) Construct the Bar Graph of the relative frequency distribution.5. Compute the Variance and Standard Deviation of a sample of data: 8, 6, 1, 3. 6. Give the five number summary for the data consisting of the values given below and construct the box-and-whiskers plot: 1 3 2 4 5 5 7 10 11 12 14 6 17 17 19 20 21 21.7. Find the correlation coefficient r for: X 2 3 6 8 9 7 52 8. For the data set : X 1 2 4 4 6 7 Y 6.3 5.4 5.1 2.7 1.6 2.3 a) Draw a scatter diagram. Comment on the type of relation that appears to exist between x and y. b) Given that X=3.76; Sx=2.49; Y=3.83; Sy=1.69; r=-0.86, determine the least square regression line. c) Graph the least-squares regression line on the scatter diagram drawn in part (a)
Step by Step Solution
There are 3 Steps involved in it

Get step-by-step solutions from verified subject matter experts