

Question: please show all the calculation details with explanations. 1. a. Why is the T-bond return in Table 1 shown to be independent of the state
please show all the calculation details with explanations.
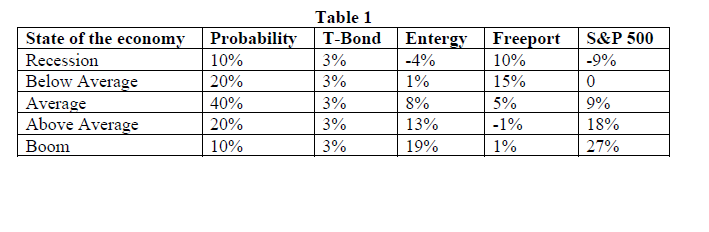
1. a. Why is the T-bond return in Table 1 shown to be independent of the state of the economy? b. Is the return on a 1-year T-bond risk-free?
2. a. Calculate the expected rate of return on each of the 4 alternatives listed in Table 1. b. Based solely on expected returns, which of the potential investments appears best?
State of the economy Recession Below Average Average Above Average Boom Probability 10% 20% 40% 20% 10% Table 1 T-Bond 3% 3% 3% 3% 3% Entergy Freeport -4% 10% 1% 15% 8% 5% 13% -1% 19% 1% S&P 500 -9% 0 9% 18% 27%
Step by Step Solution
There are 3 Steps involved in it
1 Expert Approved Answer
Step: 1 Unlock

Question Has Been Solved by an Expert!
Get step-by-step solutions from verified subject matter experts
Step: 2 Unlock
Step: 3 Unlock