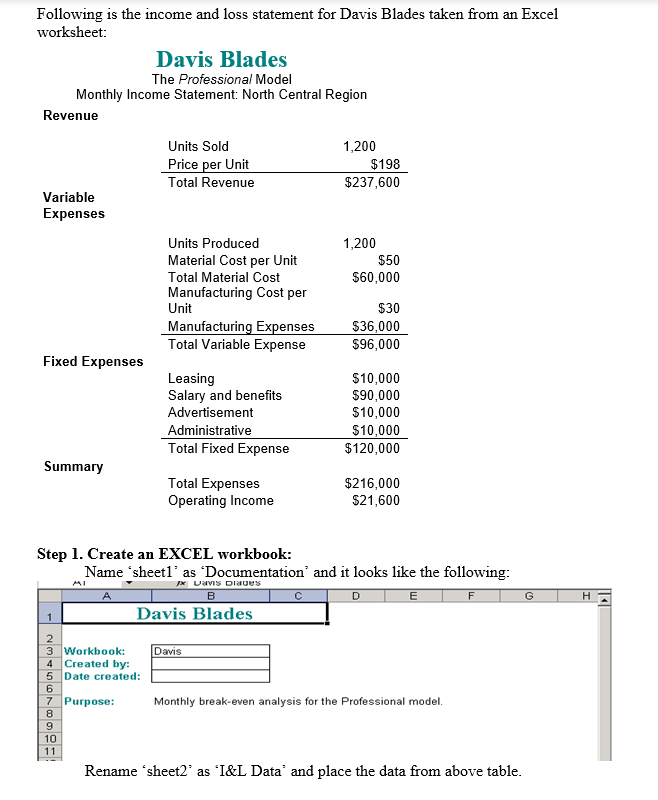
Question: Please show all the steps in the excel spreadsheet (Please do not just cope from Cheggg Following is the income and loss statement for Davis
Please show all the steps in the excel spreadsheet
(Please do not just cope from Cheggg
Following is the income and loss statement for Davis Blades taken from an Excel worksheet: Davis Blades The Professional Model Monthly Income Statement: North Central Region Revenue Units Sold 1,200 Price per Unit $198 Total Revenue $237,600 Variable Expenses Units Produced 1,200 Material Cost per Unit $50 Total Material Cost $60,000 Manufacturing Cost per Unit $30 Manufacturing Expenses $36,000 Total Variable Expense $96,000 Fixed Expenses Leasing $10,000 Salary and benefits 590,000 Advertisement $10,000 Administrative $10,000 Total Fixed Expense $120,000 Summary Total Expenses $216,000 Operating Income $21,600 Step 1. Create an EXCEL workbook: Name 'sheetl' as 'Documentation' and it looks like the following: WaVIS DiaDES A C D E F G H . Davis Blades Workbook: Davis Created by: 5 Date created: 6 7 Purpose: Monthly break-even analysis for the Professional model. 8 10 Rename 'sheet2' as 'I&L Data' and place the data from above table.Step 2. Repeat the income and loss statement for the quanties 1200 (already given), 1400, 1600, 1800, and 2000. To do this, create a new sheet, name it as 'Quantity vs. I&L' and copy 1&L Data' to it. Make a column for each quantity. Step 3. a. Prepare a graph for total revenues and total expenses for the quantities 1200, 1400, 1600, 1800, 2000 and place it in a new worksheet LlCost v. Revenues'. b. Prepare another graph that shows breakdown (components) of xed costs in a worksheet called \"Overhead'. Step 4. Prepare a projected income and loss statement for the years 2022, 2023, 2024 {data is entered in 2021) for the quantity 1200 assuming: 5% increase in sales price per unit per year, 6% increase in material cost per unit per year, 6.5% increase in manufacturing costs per unit per year. Place all the data in a worksheet called 'Projections