

Question: Please show all the steps on the excel spread sheet Following is the income and loss statement for Davis Blades taken from an Excel worksheet:
Please show all the steps on the excel spread sheet
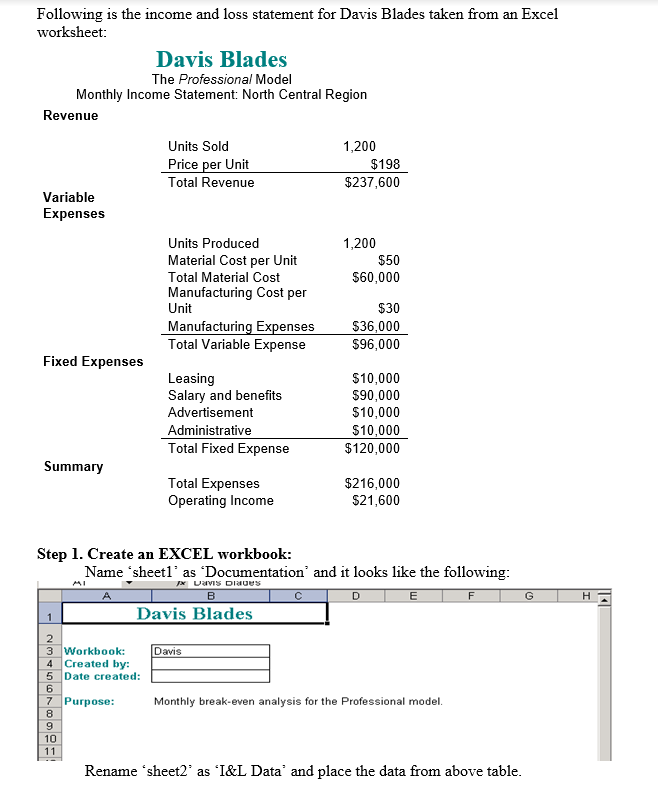
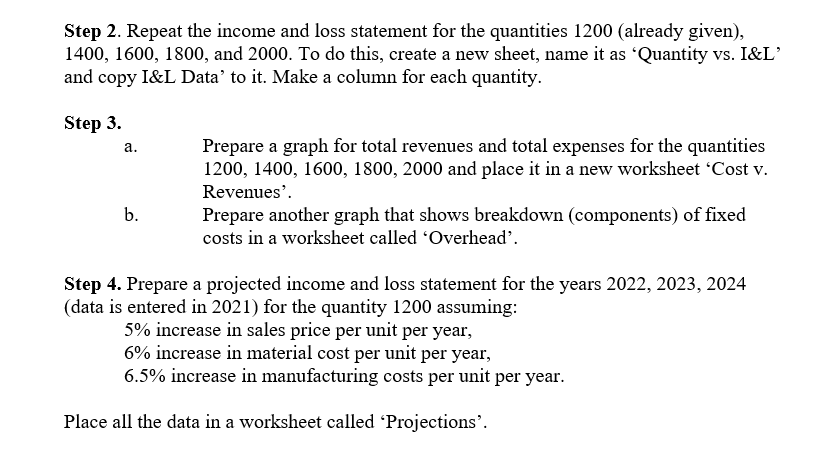
Following is the income and loss statement for Davis Blades taken from an Excel worksheet: Davis Blades The Professional Model Monthly Income Statement: North Central Region Revenue Units Sold Price per Unit Total Revenue 1,200 $198 $237,600 Variable Expenses 1,200 $50 $60,000 Units Produced Material Cost per Unit Total Material Cost Manufacturing Cost per Unit Manufacturing Expenses Total Variable Expense $30 $36,000 $96,000 Fixed Expenses Leasing Salary and benefits Advertisement Administrative Total Fixed Expense $10,000 $90,000 $10,000 $10,000 $120,000 Summary Total Expenses Operating Income $216,000 $21,600 A F G H 1 Step 1. Create an EXCEL workbook: Name 'sheetl' as 'Documentation' and it looks like the following: JX DUVs Dues B D E Davis Blades 2 3 Workbook: Davis 4 Created by: 5 Date created: 6 7 Purpose: Monthly break-even analysis for the Professional model. 8 9 10 11 Rename 'sheet2 as 'I&L Data' and place the data from above table. Step 2. Repeat the income and loss statement for the quantities 1200 (already given), 1400, 1600, 1800, and 2000. To do this, create a new sheet, name it as 'Quantity vs. I&L' and copy I&L Data to it. Make a column for each quantity. Step 3. a. Prepare a graph for total revenues and total expenses for the quantities 1200, 1400, 1600, 1800, 2000 and place it in a new worksheet 'Cost v. Revenues. Prepare another graph that shows breakdown (components) of fixed costs in a worksheet called 'Overhead'. b. Step 4. Prepare a projected income and loss statement for the years 2022, 2023, 2024 (data is entered in 2021) for the quantity 1200 assuming: 5% increase in sales price per unit per year, 6% increase in material cost per unit per year, 6.5% increase in manufacturing costs per unit per year. Place all the data in a worksheet called Projections
Step by Step Solution
There are 3 Steps involved in it

Get step-by-step solutions from verified subject matter experts