

Question: Please show ALL work :) 1. Explain plan-do-act cycle? 2. The time to replace vehicle wiper blades at a service center was monitored using a
Please show ALL work :)
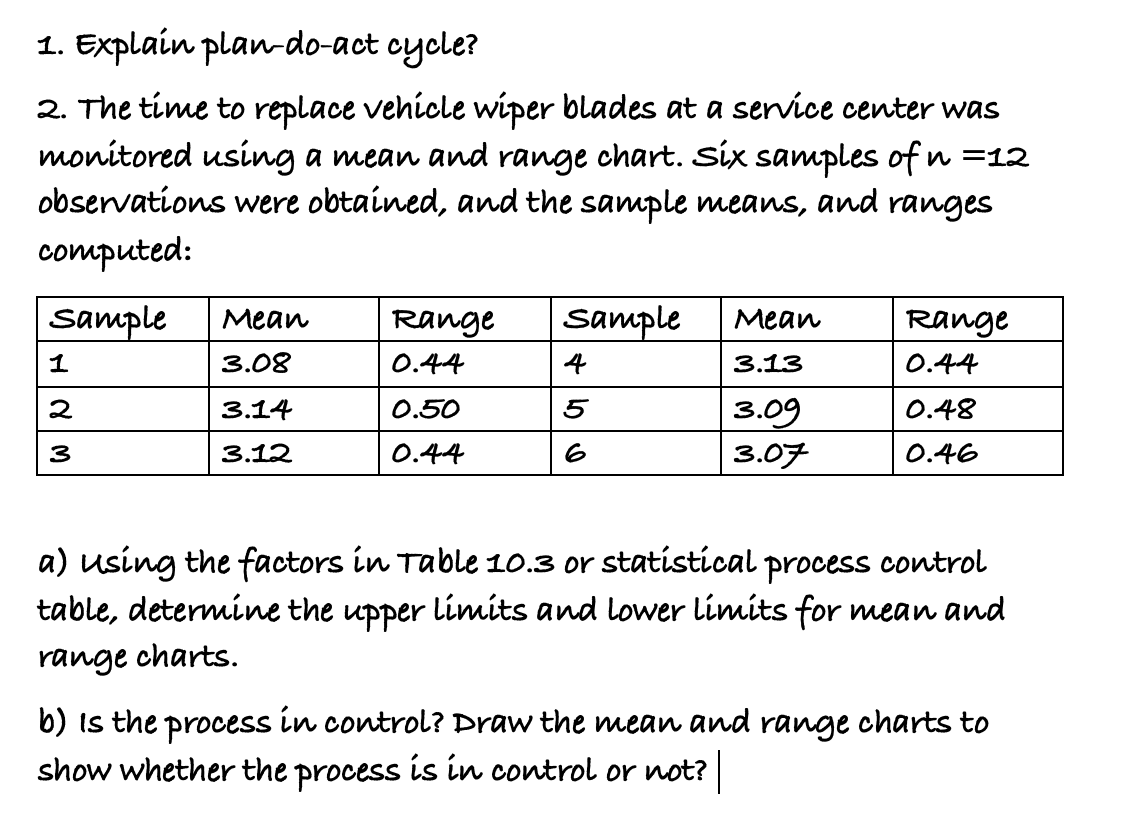
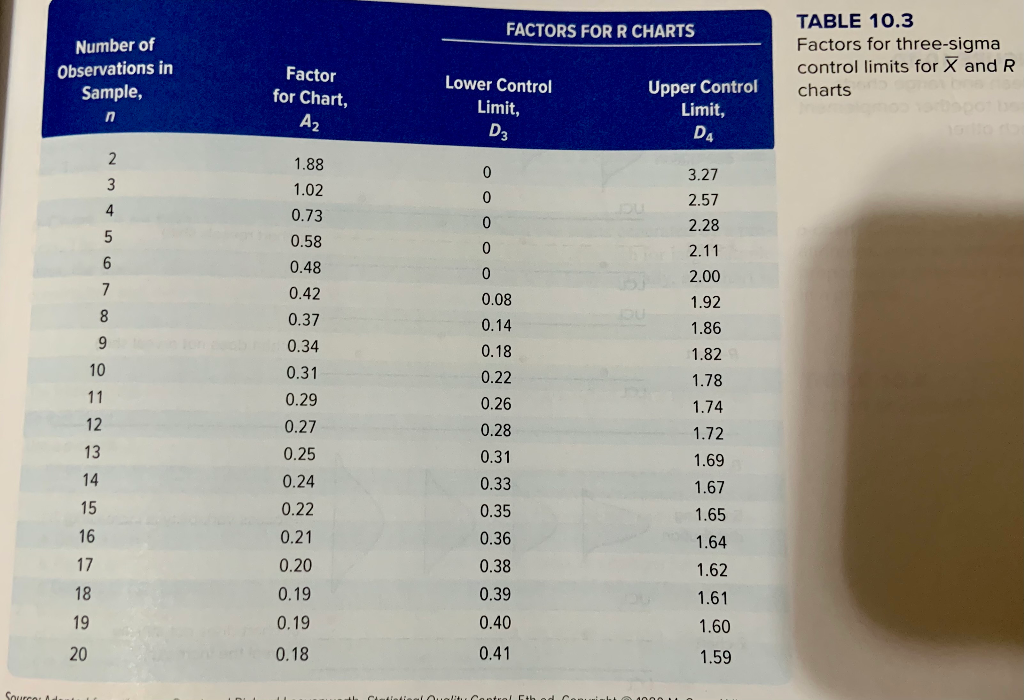
1. Explain plan-do-act cycle? 2. The time to replace vehicle wiper blades at a service center was monitored using a mean and range chart. Six samples of n =12 observations were obtained, and the sample means, and ranges computed: Sample Mean Range Sample Range 0.44 0.44 3.14 0.50 3.09 0.48 0.44 3.07 Mean 1 3.08 4 3.13 2 5 3 3.12 0.46 a) using the factors in Table 10.3 or statistical process control table, determine the upper limits and lower limits for mean and range charts. b) is the process in control? Draw the mean and range charts to show whether the process is in control or not? FACTORS FOR R CHARTS Number of Observations in Sample, n TABLE 10.3 Factors for three-sigma control limits for X and R charts Factor for Chart, A2 Lower Control Limit, D3 Upper Control Limit, D4 1.88 0 2 3 4 0 3.27 2.57 2.28 0 5 2.11 6 7 8 9 10 11 1.02 0.73 0.58 0.48 0.42 0.37 0.34 0.31 0.29 0.27 0.25 0.24 0.22 0.21 0.20 0.19 12 0 0 0.08 0.14 0.18 0.22 0.26 0.28 0.31 0.33 0.35 0.36 0.38 0.39 2.00 1.92 1.86 1.82 1.78 1.74 1.72 1.69 1.67 1.65 1.64 1.62 13 14 15 16 17 18 1.61 1.60 19 0.19 0.40 20 0.18 0.41 1.59 SourcoStep by Step Solution
There are 3 Steps involved in it
1 Expert Approved Answer
Step: 1 Unlock

Question Has Been Solved by an Expert!
Get step-by-step solutions from verified subject matter experts
Step: 2 Unlock
Step: 3 Unlock