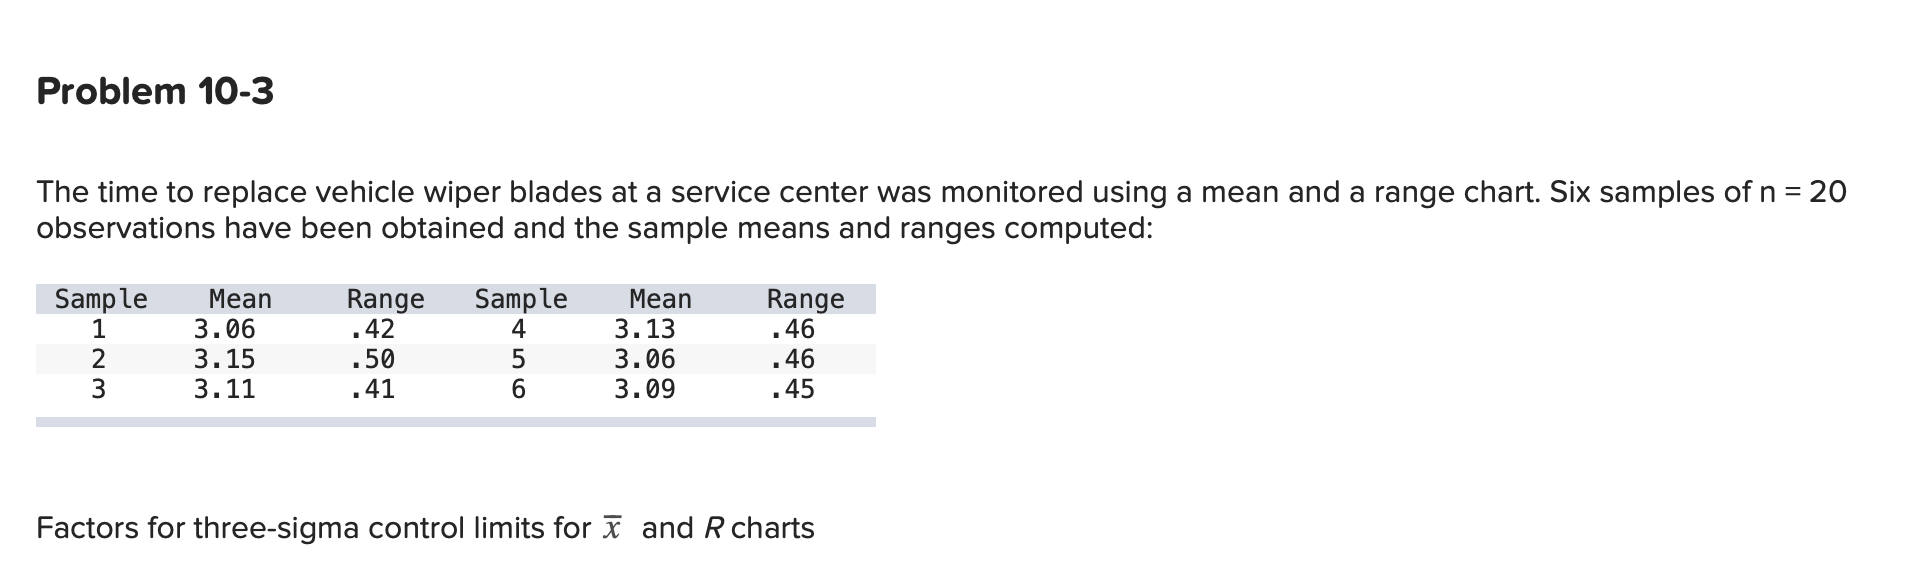
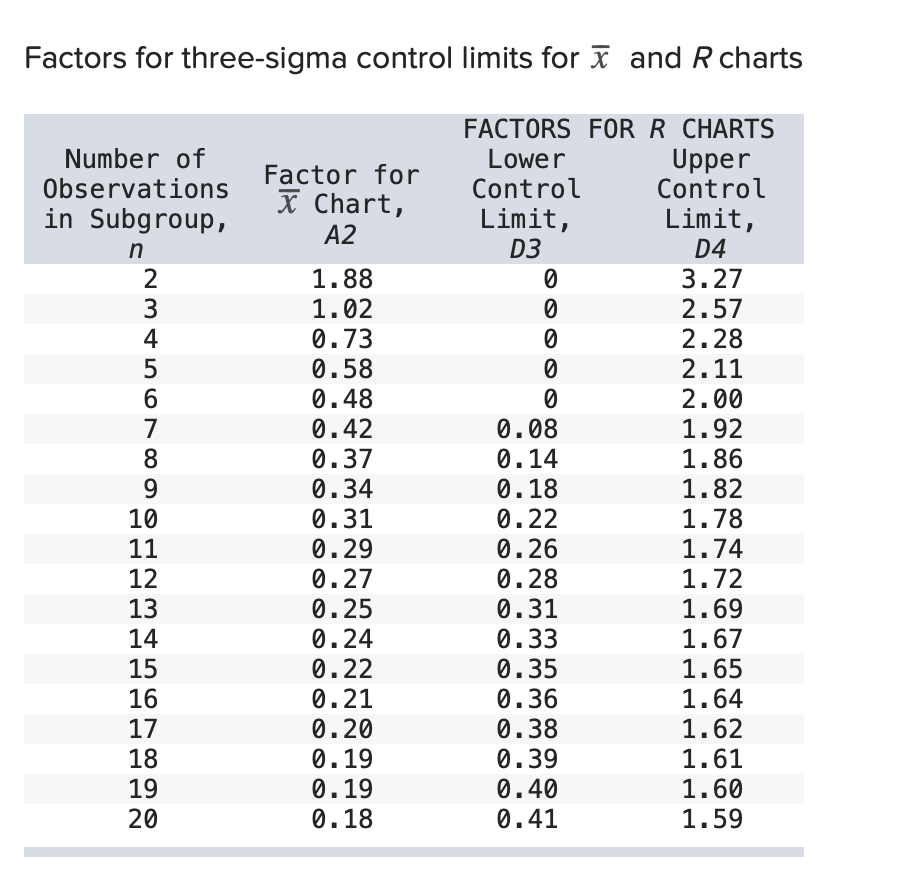
Question: Problem 10-3 The time to replace vehicle wiper blades at a service center was monitored using a mean and a range chart. Six samples of

Problem 10-3 The time to replace vehicle wiperProblem 10-3 The time to replace vehicle wiperProblem 10-3 The time to replace vehicle wiper

Problem 10-3 The time to replace vehicle wiper blades at a service center was monitored using a mean and a range chart. Six samples of n = 20 observations have been obtained and the sample means and ranges computed: Range Range .46 Sample 1 2 3 Mean 3.06 3.15 3.11 .42 .50 Sample 4 5 6 Mean 3. 13 3.06 3.09 .46 41 .45 Factors for three-sigma control limits for i and R charts Factors for three-sigma control limits for and R charts Factor for X Chart, A2 Number of Observations in Subgroup, n 2 3 4 5 6 7 8 9 10 11 12 13 14 15 16 17 18 19 20 1.88 1.02 0.73 0.58 0.48 0.42 0.37 0.34 0.31 0.29 0.27 0.25 0.24 0.22 0.21 0.20 0.19 0.19 0.18 FACTORS FOR R CHARTS Lower Upper Control Control Limit, Limit, D3 D4 0 3.27 2.57 0 2.28 2.11 0 2.00 0.08 1.92 0.14 1.86 0.18 1.82 0.22 1.78 0.26 1.74 0.28 1.72 0.31 1.69 0.33 1.67 0.35 1.65 0.36 1.64 0.38 1.62 0.39 1.61 0.40 1.60 0.41 1.59 a. Using the factors in the above table, determine upper and lower limits for mean and range charts. (Do not round intermediate calculations. Round your mean value to 3 decimal places and range value to 4 decimal places.) Upper limit for mean Lower limit for mean Upper limit for range Lower limit for range b. Is the process in control? Yes

Step by Step Solution

There are 3 Steps involved in it

1 Expert Approved Answer
Step: 1 Unlock blur-text-image
Question Has Been Solved by an Expert!

Get step-by-step solutions from verified subject matter experts

Step: 2 Unlock
Step: 3 Unlock

Students Have Also Explored These Related General Management Questions!