Question: please show all work and explain the graph in part (a) thanks Location Annual Fixed Costs Variable Costs per pair $6,500,000 $200 Colorado Springs, CO
please show all work and explain the graph in part (a)
thanks
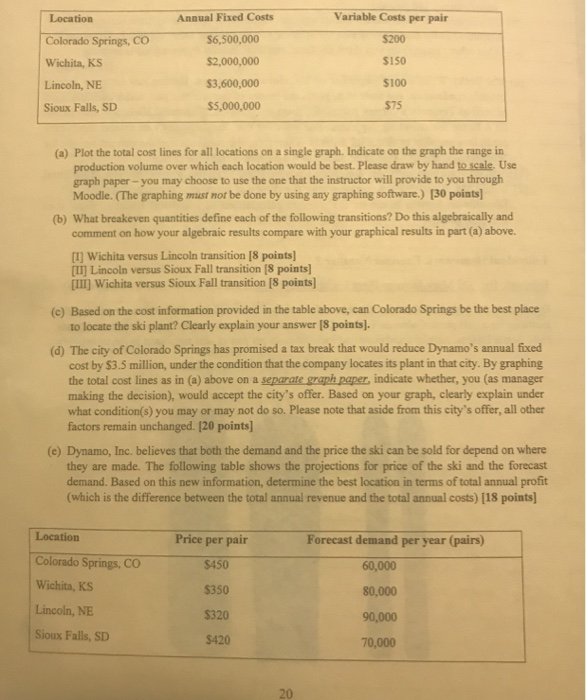
Location Annual Fixed Costs Variable Costs per pair $6,500,000 $200 Colorado Springs, CO Wichita, KS Lincoln, NE Sioux Falls, SD $2,000,000 $3,600,000 $5,000,000 $150 $100 $75 (a) Plot the total cost lines for all locations on a single graph. Indicate on the graph the range in production volume over which each location would be best. Please draw by hand to scale. Use graph paper - you may choose to use the one that the instructor will provide to you through Moodle. (The graphing must not be done by using any graphing software.) [30 points) (b) What breakeven quantities define each of the following transitions? Do this algebraically and comment on how your algebraic results compare with your graphical results in part (a) above. m] Wichita versus Lincoln transition [8 points] [LI] Lincoln versus Sioux Fall transition 8 points] [III] Wichita versus Sioux Fall transition [8 points) (c) Based on the cost information provided in the table above, can Colorado Springs be the best place to locate the ski plant? Clearly explain your answer 18 points). (d) The city of Colorado Springs has promised a tax break that would reduce Dynamo's annual fixed cost by $3.5 million, under the condition that the company locates its plant in that city. By graphing! the total cost lines as in (a) above on a separate graph paper indicate whether, you as manager making the decision), would accept the city's offer. Based on your graph, clearly explain under what condition(s) you may or may not do so. Please note that aside from this city's offer, all other factors remain unchanged. (20 points] (e) Dynamo, Inc, believes that both the demand and the price the ski can be sold for depend on where they are made. The following table shows the projections for price of the ski and the forecast demand. Based on this new information, determine the best location in terms of total annual profit (which is the difference between the total annual revenue and the total annual costs) [18 points) Location Forecast demand per year (pairs) 60,000 Price per pair $450 $350 $320 $420 Colorado Springs, CO Wichita, KS Lincoln, NE Sioux Falls, SD 80,000 90,000 70,000


