Question: please show all work so i can learn how to do this. fill in the empty boxes The following table shows the actual demand observed

please show all work so i can learn how to do this. fill in the empty boxes please show all work so i can learn how to do
The following table shows the actual demand observed over the last 11 years: 9 Year Demand 1 8 2 9 3 5 4 7 5 13 6 9 7 11 8 12 10 9 11 6 8 Using exponential smoothing with a = 0.50 and a forecast for year 1 of 70, provide the forecast from periods 2 through 12 (round your responses to one decimal place) Year 1 2 3 4 5 6 7 8 9 10 11 9.3 12 77 Forecast 70 7.5 8.3 6.7 6.9 10 9.5 10.3 11.2 9.6 Provide the forecast from periods 2 through 12 using the naive approach (enter your responses as whole numbers) Year 2 3 4 5 6 7 8 9 10 11 12 Forecast

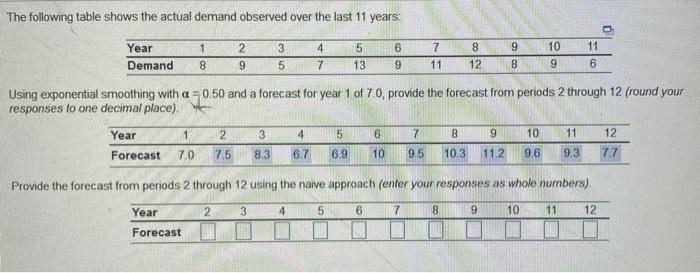
Step by Step Solution

There are 3 Steps involved in it

1 Expert Approved Answer
Step: 1 Unlock blur-text-image
Question Has Been Solved by an Expert!

Get step-by-step solutions from verified subject matter experts

Step: 2 Unlock
Step: 3 Unlock

Students Have Also Explored These Related General Management Questions!