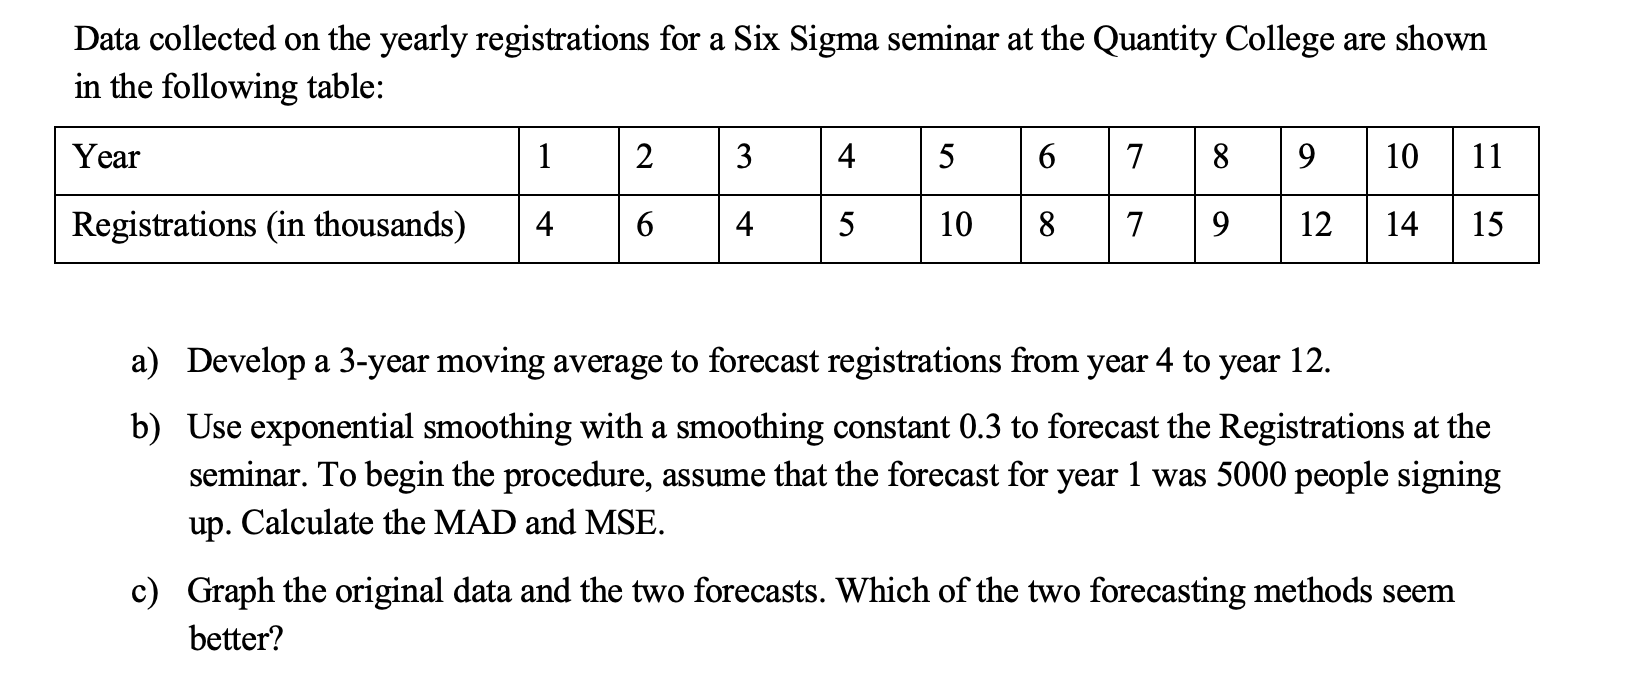
Question: PLEASE SHOW ALL WORK STEP BY STEP FOR PART A-C. THANK YOU! Data collected on the yearly registrations for a Six Sigma seminar at the

PLEASE SHOW ALL WORK STEP BY STEP FOR PART A-C. THANK YOU!

PLEASE SHOW ALL WORK STEP BY STEP FOR PART A-C.

Data collected on the yearly registrations for a Six Sigma seminar at the Quantity College are shown in the following table: Year 1 2 3 4 5 6 7 819 10 11 Registrations (in thousands) 4 6 4 5 10 8 7 9 12 14 15 a) Develop a 3-year moving average to forecast registrations from year 4 to year 12. b) Use exponential smoothing with a smoothing constant 0.3 to forecast the Registrations at the seminar. To begin the procedure, assume that the forecast for year 1 was 5000 people signing up. Calculate the MAD and MSE. c) Graph the original data and the two forecasts. Which of the two forecasting methods seem better

Step by Step Solution

There are 3 Steps involved in it

1 Expert Approved Answer
Step: 1 Unlock blur-text-image
Question Has Been Solved by an Expert!

Get step-by-step solutions from verified subject matter experts

Step: 2 Unlock
Step: 3 Unlock

Students Have Also Explored These Related General Management Questions!