

Question: Please show all your steps! 1. A mean chart is used to maintain the diameter of plastic tubing. The process is known to have a
Please show all your steps!
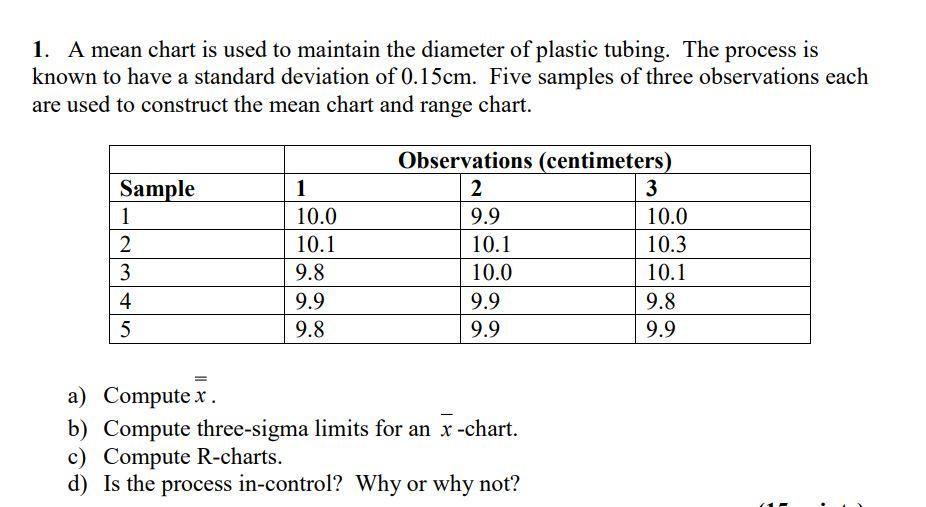
1. A mean chart is used to maintain the diameter of plastic tubing. The process is known to have a standard deviation of 0.15cm. Five samples of three observations each are used to construct the mean chart and range chart. Observations (centimeters) Sample 1 2 3 1 10.0 9.9 10.0 2 10.1 10.1 10.3 9.8 10.0 10.1 9.9 9.9 9.8 9.8 9.9 9.9 a) Computex. b) Compute three-sigma limits for an x-chart. c) Compute R-charts. d) Is the process in-control? Why or why not? S35N 3 4 5Step by Step Solution
There are 3 Steps involved in it
1 Expert Approved Answer
Step: 1 Unlock

Question Has Been Solved by an Expert!
Get step-by-step solutions from verified subject matter experts
Step: 2 Unlock
Step: 3 Unlock