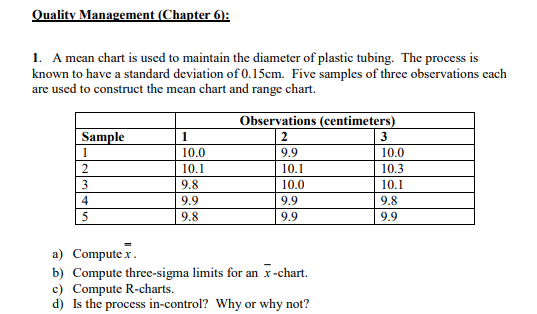
Question: Quality Management (Chapter 6): 1. A mean chart is used to maintain the diameter of plastic tubing. The process is known to have a standard

Quality Management (Chapter 6): 1. A mean chart

Quality Management (Chapter 6): 1. A mean chart is used to maintain the diameter of plastic tubing. The process is known to have a standard deviation of 0.15cm. Five samples of three observations each are used to construct the mean chart and range chart. Sample 1 2 3 4 5 1 10.0 10.1 9.8 9.9 9.8 Observations (centimeters) 2 9.9 10.1 10.0 9.9 9.9 a) Computex. b) Compute three-sigma limits for an x-chart. c) Compute R-charts. d) Is the process in-control? Why or why not? 3 10.0 10.3 10.1 9.8 9.9

Step by Step Solution

There are 3 Steps involved in it

1 Expert Approved Answer
Step: 1 Unlock blur-text-image
Question Has Been Solved by an Expert!

Get step-by-step solutions from verified subject matter experts

Step: 2 Unlock
Step: 3 Unlock

Students Have Also Explored These Related General Management Questions!