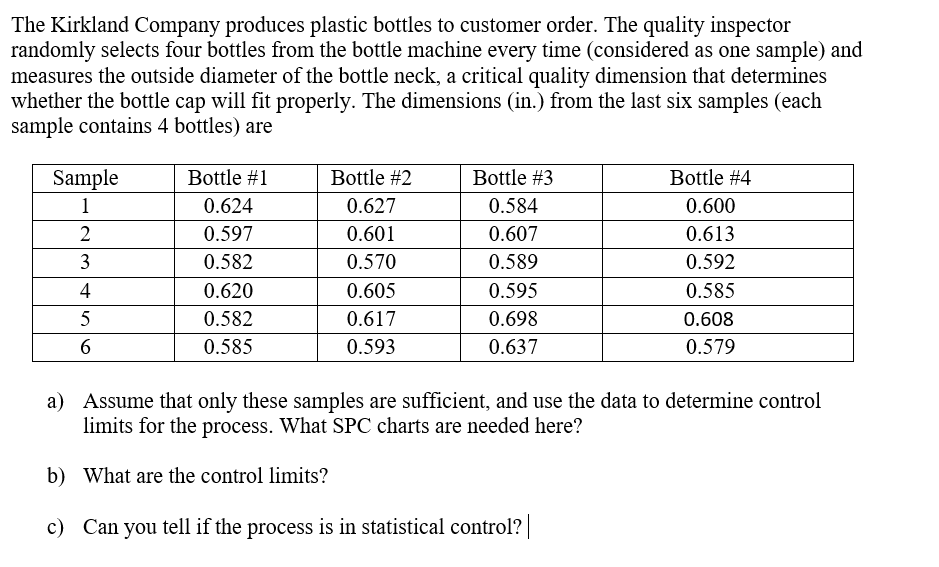
Question: Please show breakdown in Excel on how to get to the numbers. The Kirkland Company produces plastic bottles to customer order. The quality inspector randomly

Please show breakdown in Excel on how to get toPlease show breakdown in Excel on how to get to the numbers.

The Kirkland Company produces plastic bottles to customer order. The quality inspector randomly selects four bottles from the bottle machine every time (considered as one sample) and measures the outside diameter of the bottle neck, a critical quality dimension that determines whether the bottle cap will fit properly. The dimensions (in.) from the last six samples (each sample contains 4 bottles) are Sample 1 2 3 4 5 6 Bottle #1 0.624 0.597 0.582 0.620 0.582 0.585 Bottle #2 0.627 0.601 0.570 0.605 0.617 0.593 Bottle #3 0.584 0.607 0.589 0.595 0.698 0.637 Bottle #4 0.600 0.613 0.592 0.585 0.608 0.579 5 a) Assume that only these samples are sufficient, and use the data to determine control limits for the process. What SPC charts are needed here? b) What are the control limits? c) Can you tell if the process is in statistical control? ||

Step by Step Solution

There are 3 Steps involved in it

1 Expert Approved Answer
Step: 1 Unlock blur-text-image
Question Has Been Solved by an Expert!

Get step-by-step solutions from verified subject matter experts

Step: 2 Unlock
Step: 3 Unlock

Students Have Also Explored These Related General Management Questions!