

Question: PLEASE SHOW CALCULATIONS AND EQUATIONS. QUESTION 22 (10 points) - Cost of Quality and Pareto Chart Following are data on cost of quality at an
PLEASE SHOW CALCULATIONS AND EQUATIONS.
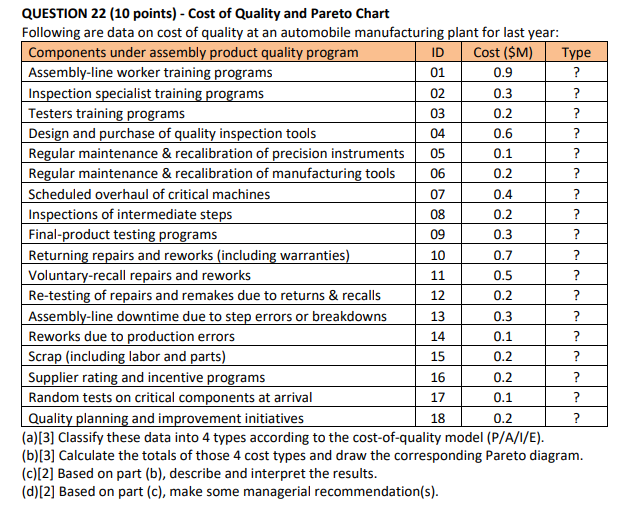
QUESTION 22 (10 points) - Cost of Quality and Pareto Chart Following are data on cost of quality at an automobile manufacturing plant for last year: Components under assembly product quality program ID Cost ($M) Type Assembly-line worker training programs 01 0.9 ? Inspection specialist training programs 02 0.3 ? Testers training programs 03 0.2 ? Design and purchase of quality inspection tools 04 0.6 ? Regular maintenance & recalibration of precision instruments 05 0.1 ? Regular maintenance & recalibration of manufacturing tools 06 0.2 ? Scheduled overhaul of critical machines 07 0.4 ? Inspections of intermediate steps 08 0.2 ? Final-product testing programs 09 0.3 ? Returning repairs and reworks (including warranties) 0.7 ? Voluntary-recall repairs and reworks 0.5 ? Re-testing of repairs and remakes due to returns & recalls 12 0.2 ? Assembly-line downtime due to step errors or breakdowns 13 0.3 ? Reworks due to production errors 14 0.1 ? Scrap (including labor and parts) 15 0.2 ? Supplier rating and incentive programs 16 0.2 ? Random tests on critical components at arrival ? Quality planning and improvement initiatives ? (a)[3] Classify these data into 4 types according to the cost-of-quality model (P/A/1/E). (b)[3] Calculate the totals of those 4 cost types and draw the corresponding Pareto diagram. (c)[2] Based on part (b), describe and interpret the results. (d) [2] Based on part (c), make some managerial recommendation(s). 10 11 17 0.1 18 0.2
Step by Step Solution
There are 3 Steps involved in it

Get step-by-step solutions from verified subject matter experts