

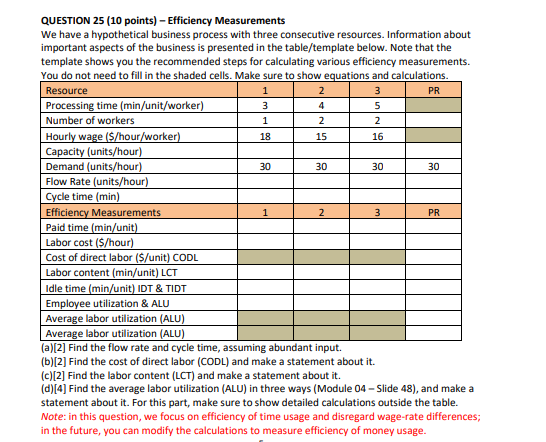
Question: please show calculations on chart by hand. Don't understand other examples. THIS IS ANOTHER EXAMPLE ON CHEGG. DONT UNDERSTAND IT. 4 1 3 1 18
please show calculations on chart by hand. Don't understand other examples.
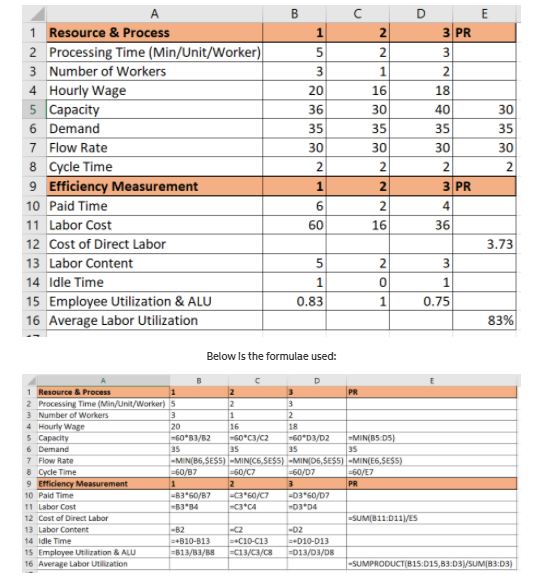
THIS IS ANOTHER EXAMPLE ON CHEGG. DONT UNDERSTAND IT.
Step by Step Solution
There are 3 Steps involved in it
1 Expert Approved Answer
Step: 1 Unlock

Question Has Been Solved by an Expert!
Get step-by-step solutions from verified subject matter experts
Step: 2 Unlock
Step: 3 Unlock