Question: Please show calculations using this data MGMT 4630 SPC Assignment #2 Process Capability Exercise Objectives: 1) Calculate capability indices and interpret them. 2) Estimate amount
Please show calculations using this data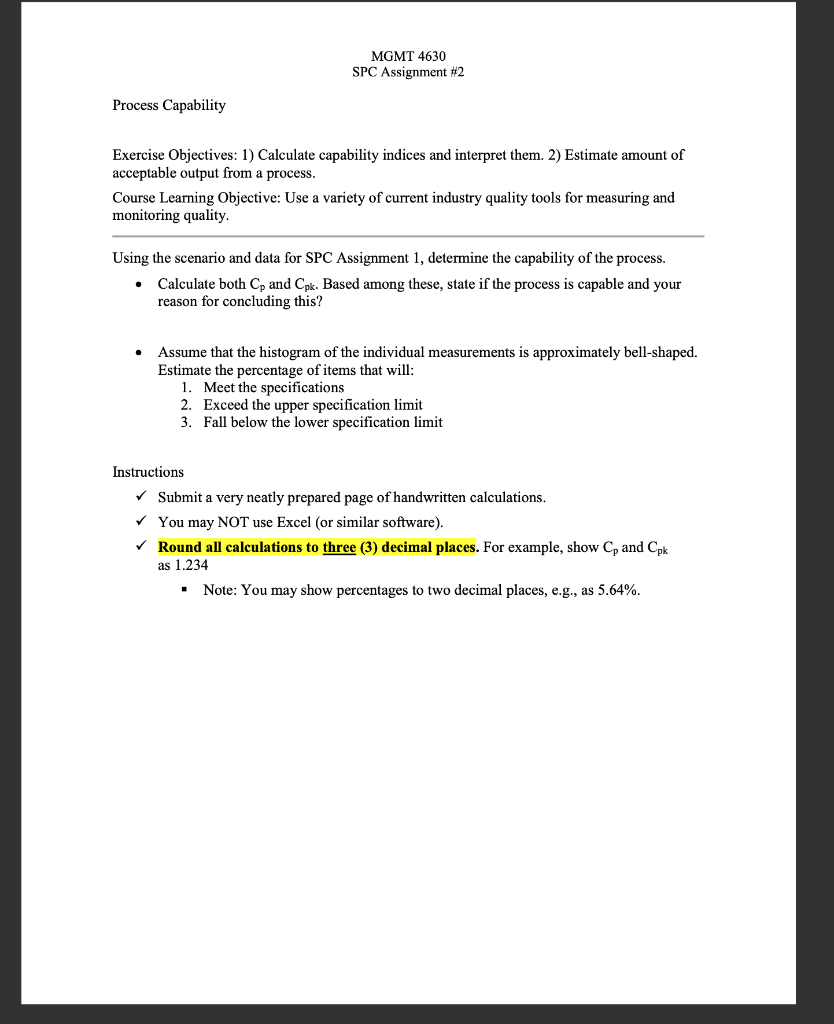
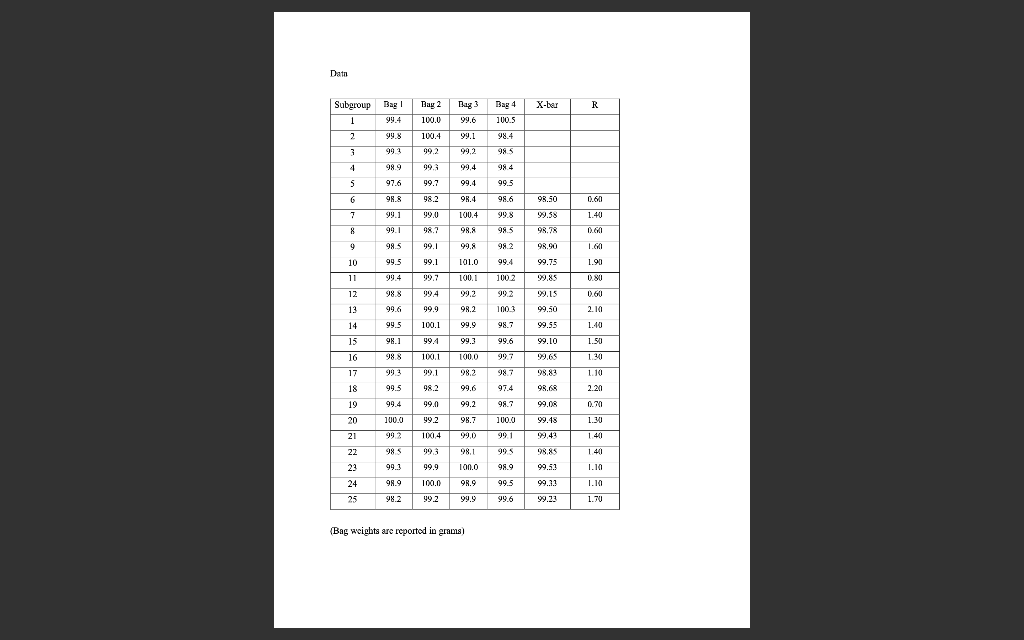
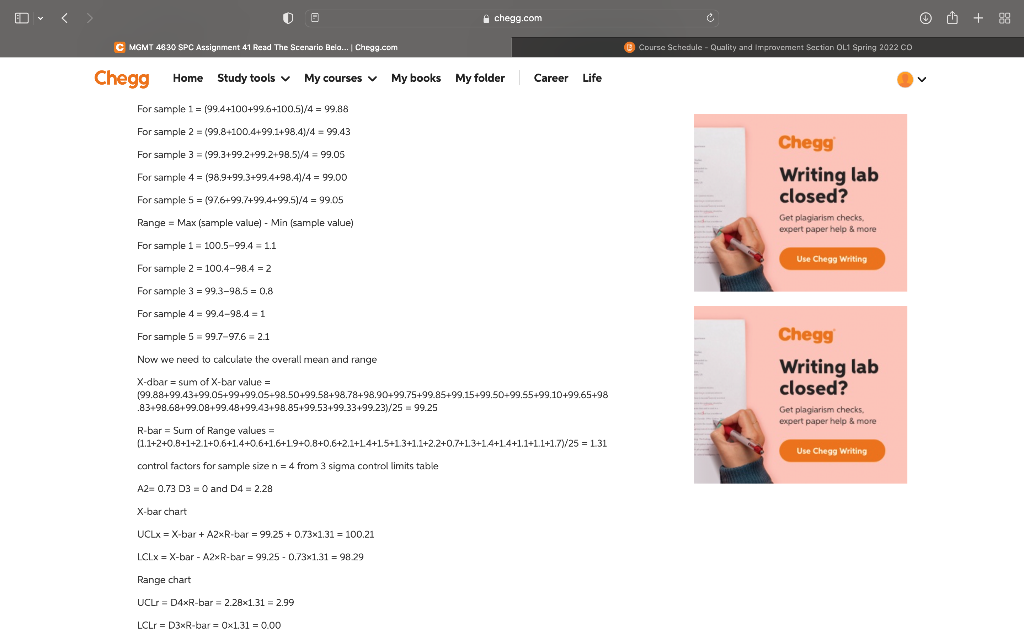
MGMT 4630 SPC Assignment #2 Process Capability Exercise Objectives: 1) Calculate capability indices and interpret them. 2) Estimate amount of acceptable output from a process. Course Learning Objective: Use a variety of current industry quality tools for measuring and monitoring quality. Using the scenario and data for SPC Assignment 1, determine the capability of the process. Calculate both Cp and Cpk. Based among these, state if the process is capable and your reason for concluding this? Assume that the histogram of the individual measurements is approximately bell-shaped. Estimate the percentage of items that will: 1. Meet the specifications 2. Exceed the upper specification limit 3. Fall below the lower specification limit Instructions Submit a very neatly prepared page of handwritten calculations. You may NOT use Excel (or similar software). Round all calculations to three (3) decimal places. For example, show Cp and Cpk as 1.234 Note: You may show percentages to two decimal places, e.g., as 5.64%. Data Day 2 Bag 3 X-ber R R Subgroup Bag 1 99.6 Bag 4 100.5 98.4 100.0 100.4 99.2 2 99.1 99,2 3 E 993 98.5 98.9 99.1 044 98.4 4 S 97.6 99.7 99.4 99.5 98.6 9 98.8 98.2 98.4 98.50 0.60 7 99.8 99.58 1.40 99.0 2. 98.7 100.4 www. 98.8 8 99.1 98.5 98.78 98.90 9 995 S 99.1 99.8 982 1.4 10 99.5 99.1 99.4 1.90 11 99,2 101.0 100.1 99.2 1002 99.75 99.85 99.15 0. 12 98.8 99.4 0.60 13 99.6 99.9 98.2 1003 99.50 2.10 14 99.5 100.1 99.9 98.7 99.55 1.40 15 98.1 99.4 99.3 99.6 99.10 1.50 16 188 10X1.1 100.0 107 1.30 17 993 99.1 98.2 98.7 98.83 1.10 18 99.5 98.2 99.6 97.4 98.6 2.20 19 99.4 99.0 99.2 98.7 99.08 0.70 20 100.0 99.2 98.7 1000 99.18 1.9 21 10X1.4 99,0 166 1.40 992 985 22 999 186 905 99 SKN ! 1 400 . 1.10 99.1 100.0 98.9 99.33 23 24 99.9 100.0 98.9 90.9 99.5 99.13 25 98.2 99.2 99.9 99.6 99.23 1.70 (Bag weights are reported in grams) chegg.com U + 88 C MGMT 4630 SPC Assignment 41 Read The Scenario Belo... | Chegg.com Course Schedule - Quality and improvement Section OL1 Spring 2022 CO My books My folder Career Life Chegg Home Study tools v My courses v My books 1 = ) = +/ For sample 1 = 199.4+100+99.6+100.5)/4 = 99.88 For sample 2 = 199.84100.4+99.1+98.41/4 = 99.43 For sample 3 = 199.3+99.2+99.2+98.574 = 99.05 For sample 4 = (98.9+99.3+99.4+98.4)/4= 99.00 Chegg Writing lab closed? Get plagiarism checks expert paper help & more For sample 5 = (97.6+99.7+99.4+99.5)/4 = 99.05 Range = Max (sample value) - Min (sample value) For sample 1 = 100.5-99.4 - 1.1 Use Chegg Writing For sample 2 = 100,4-98.4 - 2 For sample 3 = 99.3-98.5 = 0.8 For sample 4 -99.4-98.4 = 1 For sample 5 = 99.7-97.6 = 2.1 Now we need to calculate the overall mean and range X-dbar = sum of X-bar value = (99.88+99.43+99.05+99+99.05-98.50+99.58+98.78+98.90+99.75+99.85+99.15+99.50-99.55+99.10+99.65+98 .83-98.68+99.08+99.48499.43+98.85+99.53499.33499.23/25 = 99.25 Chegg Writing lab closed? Get plagiarism checks expert paper help & more Use Chegg Writing R-bar = Sum of Range values = (1.1+2+0.8+1+2.1+0.6+1.4+0.6+1.6+19+0.8+0.6+2.1+14+1.5+1.3+1.1+2.2+0.7+1.3+1 4+14+1.1+1.1+1.7)/25 = 131 control factors for sample size n = 4 from 3 sigma control limits table A2=0.73 D3 = 0 and D4 = 2.28 X-bar chart UCLX = X-bar + A2xR-bar = 99.25 +0.73x1.31 = 100.21 LCLX = X-bar - A2xR-bar = 99.25 -0.73x1.31 = 98.29 Range chart UCLr=D4xR-bar = 2.28x1.31 = 2.99 LCLT = D3xR-bar=0x1.31 = 0.00 MGMT 4630 SPC Assignment #2 Process Capability Exercise Objectives: 1) Calculate capability indices and interpret them. 2) Estimate amount of acceptable output from a process. Course Learning Objective: Use a variety of current industry quality tools for measuring and monitoring quality. Using the scenario and data for SPC Assignment 1, determine the capability of the process. Calculate both Cp and Cpk. Based among these, state if the process is capable and your reason for concluding this? Assume that the histogram of the individual measurements is approximately bell-shaped. Estimate the percentage of items that will: 1. Meet the specifications 2. Exceed the upper specification limit 3. Fall below the lower specification limit Instructions Submit a very neatly prepared page of handwritten calculations. You may NOT use Excel (or similar software). Round all calculations to three (3) decimal places. For example, show Cp and Cpk as 1.234 Note: You may show percentages to two decimal places, e.g., as 5.64%. Data Day 2 Bag 3 X-ber R R Subgroup Bag 1 99.6 Bag 4 100.5 98.4 100.0 100.4 99.2 2 99.1 99,2 3 E 993 98.5 98.9 99.1 044 98.4 4 S 97.6 99.7 99.4 99.5 98.6 9 98.8 98.2 98.4 98.50 0.60 7 99.8 99.58 1.40 99.0 2. 98.7 100.4 www. 98.8 8 99.1 98.5 98.78 98.90 9 995 S 99.1 99.8 982 1.4 10 99.5 99.1 99.4 1.90 11 99,2 101.0 100.1 99.2 1002 99.75 99.85 99.15 0. 12 98.8 99.4 0.60 13 99.6 99.9 98.2 1003 99.50 2.10 14 99.5 100.1 99.9 98.7 99.55 1.40 15 98.1 99.4 99.3 99.6 99.10 1.50 16 188 10X1.1 100.0 107 1.30 17 993 99.1 98.2 98.7 98.83 1.10 18 99.5 98.2 99.6 97.4 98.6 2.20 19 99.4 99.0 99.2 98.7 99.08 0.70 20 100.0 99.2 98.7 1000 99.18 1.9 21 10X1.4 99,0 166 1.40 992 985 22 999 186 905 99 SKN ! 1 400 . 1.10 99.1 100.0 98.9 99.33 23 24 99.9 100.0 98.9 90.9 99.5 99.13 25 98.2 99.2 99.9 99.6 99.23 1.70 (Bag weights are reported in grams) chegg.com U + 88 C MGMT 4630 SPC Assignment 41 Read The Scenario Belo... | Chegg.com Course Schedule - Quality and improvement Section OL1 Spring 2022 CO My books My folder Career Life Chegg Home Study tools v My courses v My books 1 = ) = +/ For sample 1 = 199.4+100+99.6+100.5)/4 = 99.88 For sample 2 = 199.84100.4+99.1+98.41/4 = 99.43 For sample 3 = 199.3+99.2+99.2+98.574 = 99.05 For sample 4 = (98.9+99.3+99.4+98.4)/4= 99.00 Chegg Writing lab closed? Get plagiarism checks expert paper help & more For sample 5 = (97.6+99.7+99.4+99.5)/4 = 99.05 Range = Max (sample value) - Min (sample value) For sample 1 = 100.5-99.4 - 1.1 Use Chegg Writing For sample 2 = 100,4-98.4 - 2 For sample 3 = 99.3-98.5 = 0.8 For sample 4 -99.4-98.4 = 1 For sample 5 = 99.7-97.6 = 2.1 Now we need to calculate the overall mean and range X-dbar = sum of X-bar value = (99.88+99.43+99.05+99+99.05-98.50+99.58+98.78+98.90+99.75+99.85+99.15+99.50-99.55+99.10+99.65+98 .83-98.68+99.08+99.48499.43+98.85+99.53499.33499.23/25 = 99.25 Chegg Writing lab closed? Get plagiarism checks expert paper help & more Use Chegg Writing R-bar = Sum of Range values = (1.1+2+0.8+1+2.1+0.6+1.4+0.6+1.6+19+0.8+0.6+2.1+14+1.5+1.3+1.1+2.2+0.7+1.3+1 4+14+1.1+1.1+1.7)/25 = 131 control factors for sample size n = 4 from 3 sigma control limits table A2=0.73 D3 = 0 and D4 = 2.28 X-bar chart UCLX = X-bar + A2xR-bar = 99.25 +0.73x1.31 = 100.21 LCLX = X-bar - A2xR-bar = 99.25 -0.73x1.31 = 98.29 Range chart UCLr=D4xR-bar = 2.28x1.31 = 2.99 LCLT = D3xR-bar=0x1.31 = 0.00


