

Question: please show computations and excel steps. Consider again the same situation with 4 assets and the following expected rates of return and variance-covariance matrix: U=
 please show computations and excel steps.
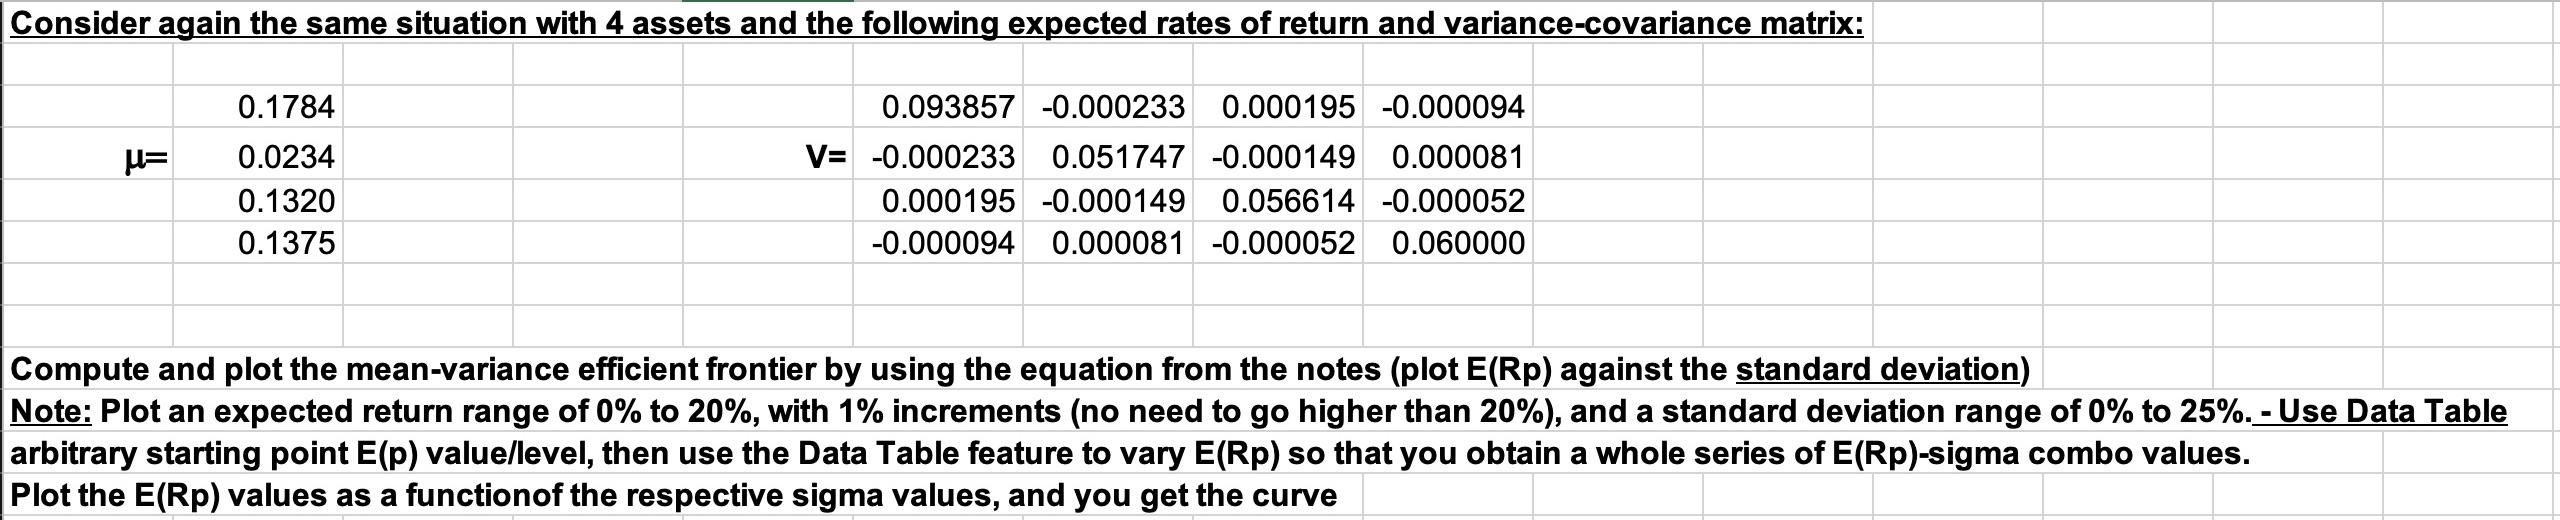
Consider again the same situation with 4 assets and the following expected rates of return and variance-covariance matrix: U= 0.1784 0.0234 0.1320 0.1375 0.093857 -0.000233 0.000195 -0.000094 V= -0.000233 0.051747 -0.000149 0.000081 0.000195 -0.000149 0.056614 -0.000052 -0.000094 0.000081 -0.000052 0.060000 Compute and plot the mean-variance efficient frontier by using the equation from the notes (plot E(Rp) against the standard deviation) Note: Plot an expected return range of 0% to 20%, with 1% increments (no need to go higher than 20%), and a standard deviation range of 0% to 25%. - Use Data Table arbitrary starting point E(p) value/level, then use the Data Table feature to vary E(Rp) so that you obtain a whole series of E(Rp)-sigma combo values. Plot the E(Rp) values as a functionof the respective sigma values, and you get the curve
Step by Step Solution
There are 3 Steps involved in it

Get step-by-step solutions from verified subject matter experts