

Question: please show each step on how to get the values for A2, D3, D4 Wait time (brs) at the DMV is monitored using a mean
please show each step on how to get the values for A2, D3, D4 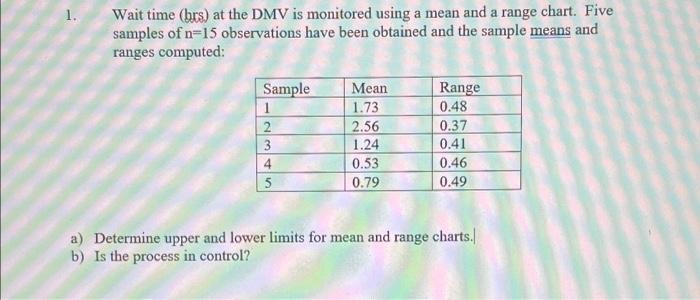
Wait time (brs) at the DMV is monitored using a mean and a range chart. Five samples of n=15 observations have been obtained and the sample means and ranges computed: Sample 2 3 4 5 Mean 1.73 2.56 1.24 0.53 0.79 Range 0.48 0.37 0.41 0.46 0.49 a) Determine upper and lower limits for mean and range charts. b) Is the process in control
Step by Step Solution
There are 3 Steps involved in it
1 Expert Approved Answer
Step: 1 Unlock

Question Has Been Solved by an Expert!
Get step-by-step solutions from verified subject matter experts
Step: 2 Unlock
Step: 3 Unlock