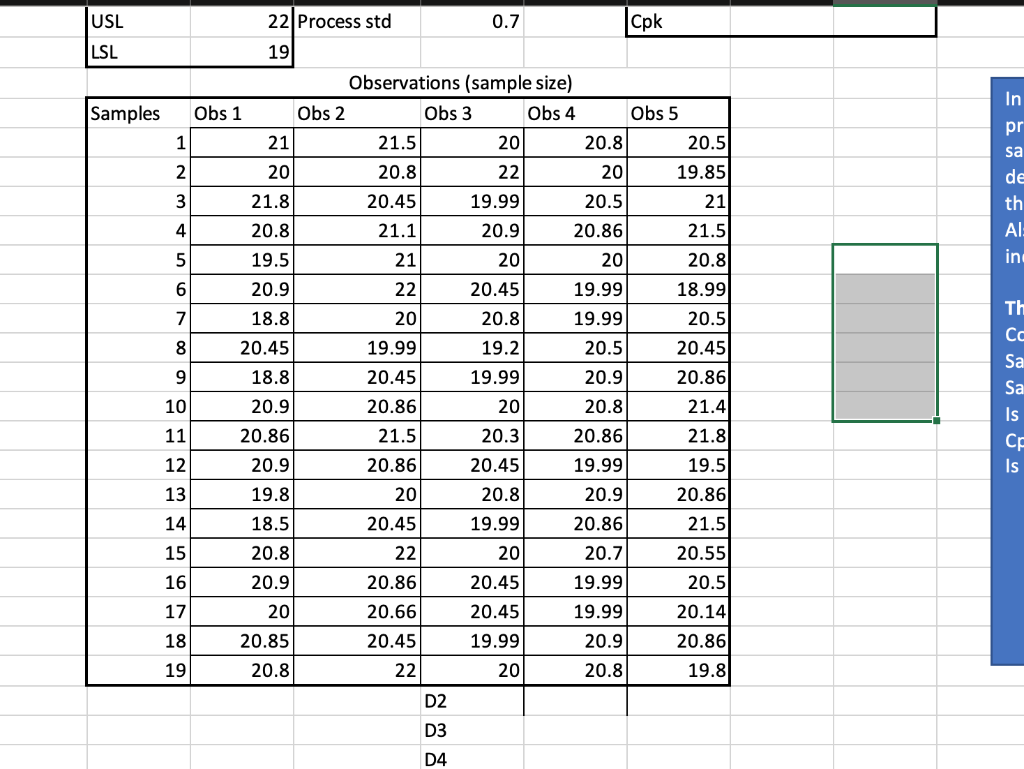
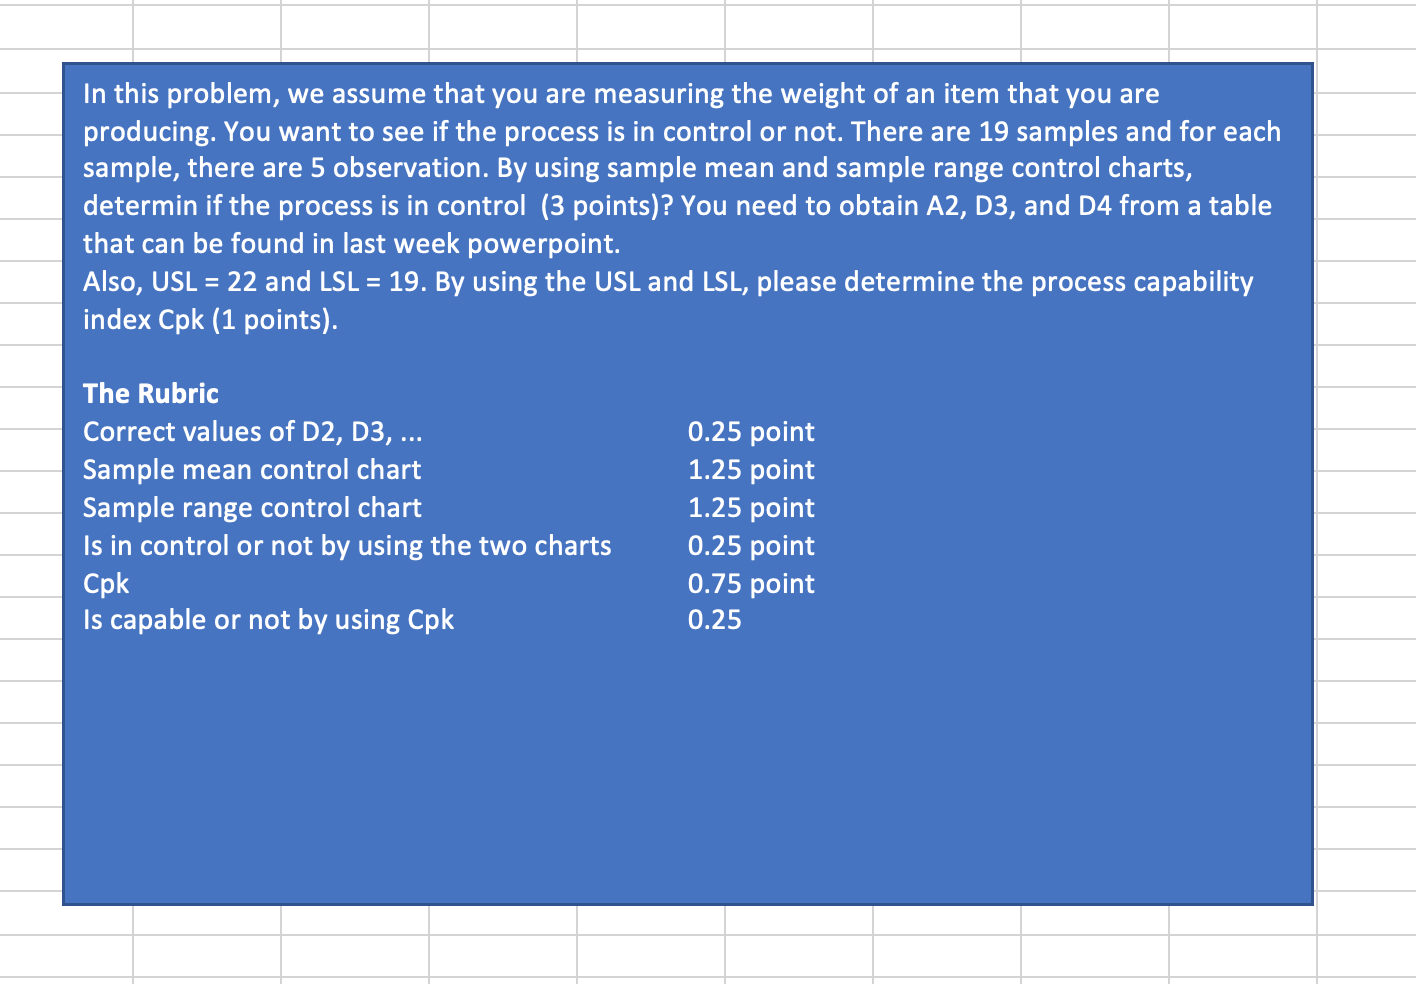
Question: PLEASE SHOW EXCEL STEP BY STEP SOLUTION. In pr sa de th 21.8 AI: in USL 22 Process std 0.7 Cpk LSL 19 Observations (sample

PLEASE SHOW EXCEL STEP BY STEP SOLUTION. In pr saPLEASE SHOW EXCEL STEP BY STEP SOLUTION. In pr saPLEASE SHOW EXCEL STEP BY STEP SOLUTION.

In pr sa de th 21.8 AI: in USL 22 Process std 0.7 Cpk LSL 19 Observations (sample size) Samples Obs 1 Obs 2 Obs 3 Obs 4 Obs 5 1 21 21.5 20 20.8 20.5 2 20 20.8 22 20 19.85 3 20.45 19.99 20.5 21 4 20.8 21.1 20.9 20.86 21.5 5 19.5 21 20 20 20.8 6 20.9 22 20.45 19.99 18.99 18.8 20 20.8 19.99 20.5 8 20.45 19.99 19.2 20.5 20.45 9 20.45 19.99 20.9 20.86 10 20.9 20.86 20 20.8 21.4 11 20.86 21.5 20.3 20.86 21.8 12 20.9 20.86 20.45 19.99 19.5 13 19.8 20 20.8 20.9 20.86 14 18.5 20.45 19.99 20.86 21.5 15 20.8 22 20 20.7 20.55 16 20.9 20.86 20.45 19.99 20.5 17 20 20.66 20.45 19.99 20.14 18 20.85 20.45 19.99 20.9 20.86 19 20.8 22 20 20.8 19.8 D2 D3 Th Sa Sa 18.8 Is CE Is D4 In this problem, we assume that you are measuring the weight of an item that you are producing. You want to see if the process is in control or not. There are 19 samples and for each sample, there are 5 observation. By using sample mean and sample range control charts, determin if the process is in control (3 points)? You need to obtain A2, D3, and D4 from a table that can be found in last week powerpoint. Also, USL = 22 and LSL = 19. By using the USL and LSL, please determine the process capability index Cpk (1 points). The Rubric Correct values of D2, D3, ... Sample mean control chart Sample range control chart Is in control or not by using the two charts Cpk Is capable or not by using Cpk 0.25 point 1.25 point 1.25 point 0.25 point 0.75 point 0.25

Step by Step Solution

There are 3 Steps involved in it

1 Expert Approved Answer
Step: 1 Unlock blur-text-image
Question Has Been Solved by an Expert!

Get step-by-step solutions from verified subject matter experts

Step: 2 Unlock
Step: 3 Unlock

Students Have Also Explored These Related General Management Questions!