

Question: please show equations used :) 26. The following data were collected during a study of consumer buying patterns: Observation 1 15 74 80 2 25
please show equations used :) 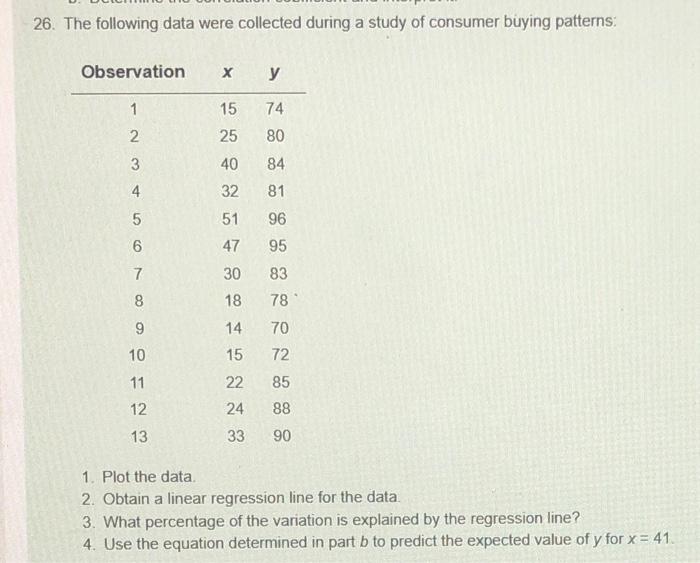
26. The following data were collected during a study of consumer buying patterns: Observation 1 15 74 80 2 25 3 40 84 4. 32 81 5 51 96 6 47 95 7 30 83 8 18 78 9 14 70 10 72 11 85 15 22 24 33 12 88 90 13 1. Plot the data 2. Obtain a linear regression line for the data. 3. What percentage of the variation is explained by the regression line? 4. Use the equation determined in part b to predict the expected value of y for x = 41 Step by Step Solution
There are 3 Steps involved in it
1 Expert Approved Answer
Step: 1 Unlock

Question Has Been Solved by an Expert!
Get step-by-step solutions from verified subject matter experts
Step: 2 Unlock
Step: 3 Unlock