

Question: please show everything in excel with cell reference. F G H par 100 1 Issuer 2 Theartcommunications 3 Revlon Consumer Products 4 Petroleum Geo Services
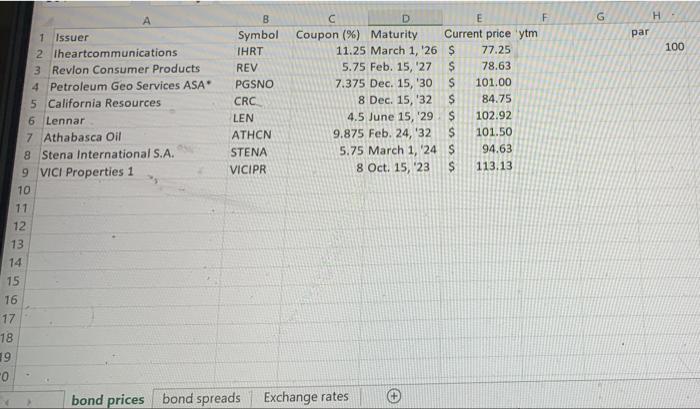
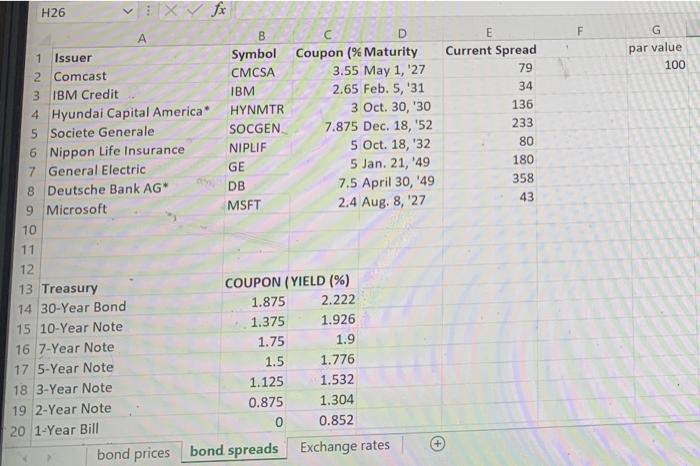
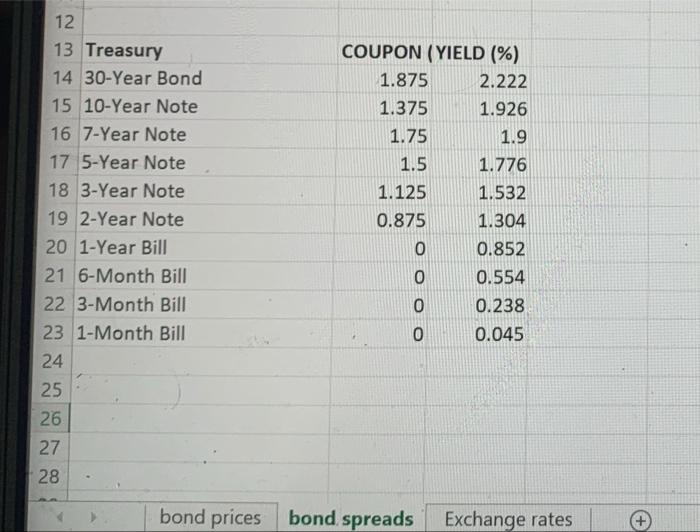
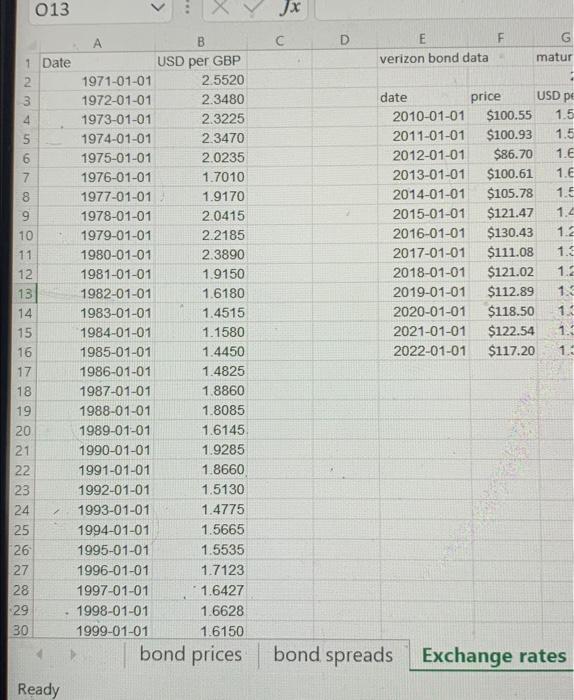
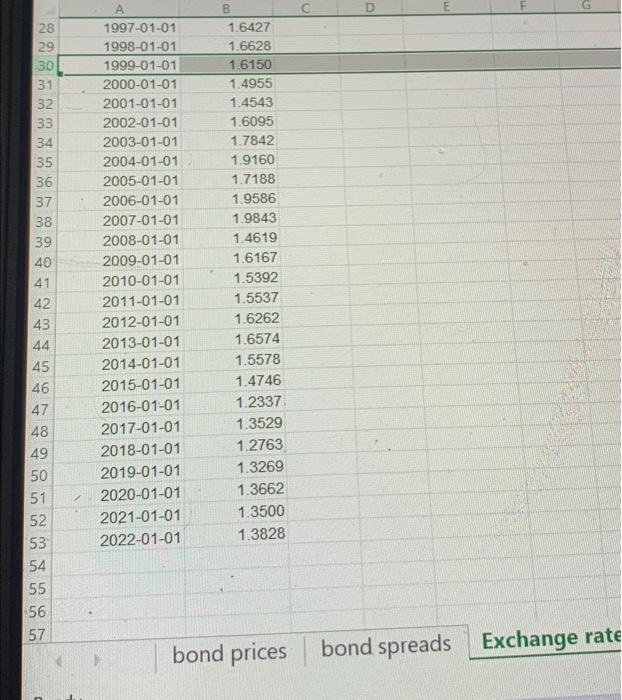
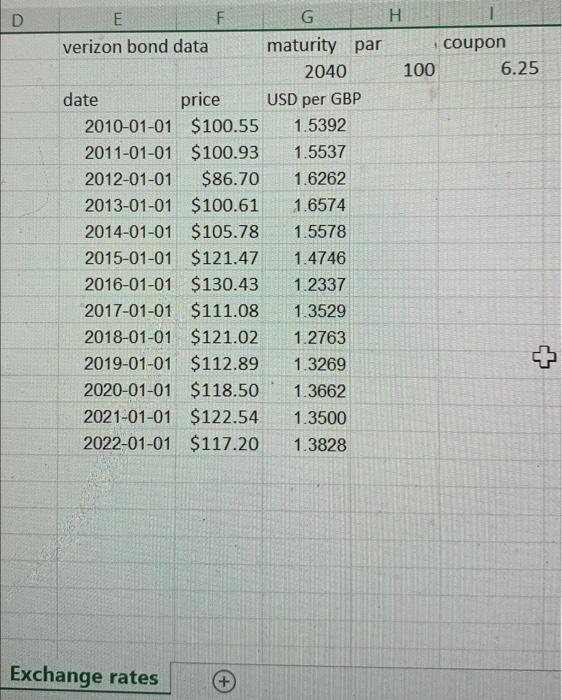
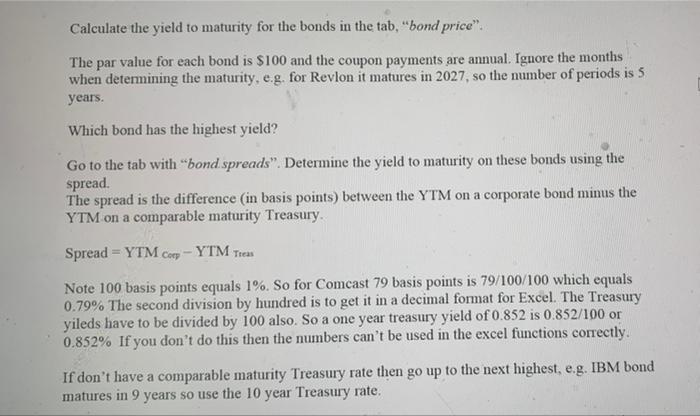
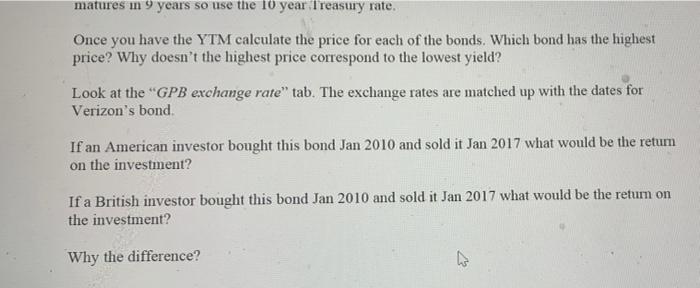
F G H par 100 1 Issuer 2 Theartcommunications 3 Revlon Consumer Products 4 Petroleum Geo Services ASA" 5 California Resources 6 Lennar 7 Athabasca Oil 8 Stena International S.A. 9 VICI Properties 1 10 B Symbol IHRT REV PGSNO CRC LEN ATHCN STENA VICIPR D E Coupon (%) Maturity Current price 'ytm 11.25 March 1, 26 $ 77.25 5.75 Feb. 15, '27 $ 78.63 7.375 Dec. 15,30 $ 101.00 8 Dec. 15,32 $ 84.75 4.5 June 15, 29 $ 102.92 9.875 Feb. 24,32 $ 101.50 5.75 March 1, 24 $ 94.63 8 Oct. 15, 23 $ 113.13 11 12 13 14 15 16 17 18 19 "0 bond prices bond spreads Exchange rates o F G par value 100 E Current Spread 79 34 136 233 80 180 358 43 H26 VX fx B C D 1 Issuer Symbol Coupon (% Maturity 2 Comcast CMCSA 3.55 May 1, '27 3 IBM Credit IBM 2.65 Feb. 5, '31 4 Hyundai Capital America HYNMTR 3 Oct. 30, '30 5 Societe Generale SOCGEN 7.875 Dec. 18, '52 6 Nippon Life Insurance NIPLIF 5 Oct. 18,32 7 General Electric GE 5 Jan. 21, 49 8 Deutsche Bank AG DB 7.5 April 30, 49 9 Microsoft MSFT 2.4 Aug. 8,27 10 11 12 13 Treasury COUPON (YIELD (%) 14 30-Year Bond 1.875 2.222 15 10-Year Note 1.375 1.926 16 7-Year Note 1.75 1.9 17 5-Year Note 1.5 1.776 18 3-Year Note 1.125 1.532 19 2-Year Note 0.875 1.304 20 1-Year Bill 0 0.852 bond prices bond spreads Exchange rates + 12 13 Treasury 14 30-Year Bond 15 10-Year Note 16 7-Year Note 17 5-Year Note 18 3-Year Note 19 2-Year Note 20 1-Year Bill 21 6-Month Bill 22 3-Month Bill 23 1-Month Bill 24 25 26 27 COUPON (YIELD (%) 1.875 2.222 1.375 1.926 1.75 1.9 1.5 1.776 1.125 1.532 0.875 1.304 0 0.852 0 0.554 0 0.238 0 0.045 28 bond prices bond spreads Exchange rates 013 Jx D F G E verizon bond data matur USD pe 5 B 1 Date USD per GBP 2 1971-01-01 2.5520 3 1972-01-01 2.3480 4 1973-01-01 2.3225 5 1974-01-01 2.3470 1975-01-01 2.0235 7 1976-01-01 1.7010 8 1977-01-01 1.9170 1978-01-01 2.0415 10 1979-01-01 2.2185 11 1980-01-01 2.3890 12 1981-01-01 1.9150 13 1982-01-01 1.6180 14 1983-01-01 1.4515 15 1984-01-01 1.1580 16 1985-01-01 1.4450 17 1986-01-01 1.4825 18 1987-01-01 1.8860 19 1988-01-01 1.8085 20 1989-01-01 1.6145 21 1990-01-01 1.9285 22 1991-01-01 1.8660 23 1992-01-01 1.5130 24 1993-01-01 1.4775 25 1994-01-01 1.5665 26 1995-01-01 1.5535 27 1996-01-01 1.7123 28 1997-01-01 - 1.6427 29 1998-01-01 1.6628 30 1999-01-01 1.6150 bond prices date price 2010-01-01 $100.55 2011-01-01 $100.93 2012-01-01 $86.70 2013-01-01 $100.61 2014-01-01 $105.78 2015-01-01 $121.47 2016-01-01 $130.43 2017-01-01 $111.08 2018-01-01 $121.02 2019-01-01 $112.89 2020-01-01 $118.50 2021-01-01 $122.54 2022-01-01 $117.20 1.5 1.5 1.6 1.6 1.5 1.4 1.2 1.3 1.2 1.3 1. 1. 1.1 1 1 1 CO WNNS bond spreads Exchange rates Ready D 28 NO U 29 30 31 32 33 34 35 36 37 38 39 40 41 42 43 44 45 46 47 48 49 50 51 52 53 54 55 56 57 u au 980 M WWW A 1997-01-01 1998-01-01 1999-01-01 2000-01-01 2001-01-01 2002-01-01 2003-01-01 2004-01-01 2005-01-01 2006-01-01 2007-01-01 2008-01-01 2009-01-01 2010-01-01 2011-01-01 2012-01-01 2013-01-01 2014-01-01 2015-01-01 2016-01-01 2017-01-01 2018-01-01 2019-01-01 2020-01-01 2021-01-01 2022-01-01 1.6427 1.6628 1.6150 1.4955 1.4543 1.6095 1.7842 1.9160 1.7188 1.9586 1.9843 1.4619 1.6167 1.5392 1.5537 1.6262 1.6574 1.5578 1.4746 1.2337 1.3529 1.2763 1.3269 1.3662 1.3500 1.3828 bond prices bond spreads Exchange rate D E F G H verizon bond data maturity par coupon 2040 100 6.25 date price USD per GBP 2010-01-01 $100.55 1.5392 2011-01-01 $100.93 1.5537 2012-01-01 $86.70 1.6262 2013-01-01 $100.61 1.6574 2014-01-01 $105.78 1.5578 2015-01-01 $121.47 1.4746 2016-01-01 $130.43 1.2337 2017-01-01 $111.08 1.3529 2018-01-01 $121.02 1.2763 2019-01-01 $112.89 1.3269 2020-01-01 $118.50 1.3662 2021-01-01 $122.54 1.3500 2022-01-01 $117.20 1.3828 Exchange rates Calculate the yield to maturity for the bonds in the tab, "bond price". The par value for each bond is $100 and the coupon payments are annual. Ignore the months when determining the maturity, e.g. for Revlon it matures in 2027, so the number of periods is 5 years. Which bond has the highest yield? Go to the tab with "bond spreads". Determine the yield to maturity on these bonds using the spread. The spread is the difference (in basis points) between the YTM on a corporate bond minus the YTM on a comparable maturity Treasury. Spread =YTM Cory - YTM The Note 100 basis points equals 1%. So for Comcast 79 basis points is 79/100/100 which equals 0.79% The second division by hundred is to get it in a decimal format for Excel. The Treasury yileds have to be divided by 100 also. So a one year treasury yield of 0.852 is 0.852/100 or 0.852% If you don't do this then the numbers can't be used in the excel functions correctly. If don't have a comparable maturity Treasury rate then go up to the next highest, e.g. IBM bond matures in 9 years so use the 10 year Treasury rate. matures m 9 years so use the 10 year Treasury rate. Once you have the YTM calculate the price for each of the bonds. Which bond has the highest price? Why doesn't the highest price correspond to the lowest yield? Look at the "GPB exchange rate" tab. The exchange rates are matched up with the dates for Verizon's bond If an American investor bought this bond Jan 2010 and sold it Jan 2017 what would be the retum on the investment? If a British investor bought this bond Jan 2010 and sold it Jan 2017 what would be the return on the investment? Why the difference? F G H par 100 1 Issuer 2 Theartcommunications 3 Revlon Consumer Products 4 Petroleum Geo Services ASA" 5 California Resources 6 Lennar 7 Athabasca Oil 8 Stena International S.A. 9 VICI Properties 1 10 B Symbol IHRT REV PGSNO CRC LEN ATHCN STENA VICIPR D E Coupon (%) Maturity Current price 'ytm 11.25 March 1, 26 $ 77.25 5.75 Feb. 15, '27 $ 78.63 7.375 Dec. 15,30 $ 101.00 8 Dec. 15,32 $ 84.75 4.5 June 15, 29 $ 102.92 9.875 Feb. 24,32 $ 101.50 5.75 March 1, 24 $ 94.63 8 Oct. 15, 23 $ 113.13 11 12 13 14 15 16 17 18 19 "0 bond prices bond spreads Exchange rates o F G par value 100 E Current Spread 79 34 136 233 80 180 358 43 H26 VX fx B C D 1 Issuer Symbol Coupon (% Maturity 2 Comcast CMCSA 3.55 May 1, '27 3 IBM Credit IBM 2.65 Feb. 5, '31 4 Hyundai Capital America HYNMTR 3 Oct. 30, '30 5 Societe Generale SOCGEN 7.875 Dec. 18, '52 6 Nippon Life Insurance NIPLIF 5 Oct. 18,32 7 General Electric GE 5 Jan. 21, 49 8 Deutsche Bank AG DB 7.5 April 30, 49 9 Microsoft MSFT 2.4 Aug. 8,27 10 11 12 13 Treasury COUPON (YIELD (%) 14 30-Year Bond 1.875 2.222 15 10-Year Note 1.375 1.926 16 7-Year Note 1.75 1.9 17 5-Year Note 1.5 1.776 18 3-Year Note 1.125 1.532 19 2-Year Note 0.875 1.304 20 1-Year Bill 0 0.852 bond prices bond spreads Exchange rates + 12 13 Treasury 14 30-Year Bond 15 10-Year Note 16 7-Year Note 17 5-Year Note 18 3-Year Note 19 2-Year Note 20 1-Year Bill 21 6-Month Bill 22 3-Month Bill 23 1-Month Bill 24 25 26 27 COUPON (YIELD (%) 1.875 2.222 1.375 1.926 1.75 1.9 1.5 1.776 1.125 1.532 0.875 1.304 0 0.852 0 0.554 0 0.238 0 0.045 28 bond prices bond spreads Exchange rates 013 Jx D F G E verizon bond data matur USD pe 5 B 1 Date USD per GBP 2 1971-01-01 2.5520 3 1972-01-01 2.3480 4 1973-01-01 2.3225 5 1974-01-01 2.3470 1975-01-01 2.0235 7 1976-01-01 1.7010 8 1977-01-01 1.9170 1978-01-01 2.0415 10 1979-01-01 2.2185 11 1980-01-01 2.3890 12 1981-01-01 1.9150 13 1982-01-01 1.6180 14 1983-01-01 1.4515 15 1984-01-01 1.1580 16 1985-01-01 1.4450 17 1986-01-01 1.4825 18 1987-01-01 1.8860 19 1988-01-01 1.8085 20 1989-01-01 1.6145 21 1990-01-01 1.9285 22 1991-01-01 1.8660 23 1992-01-01 1.5130 24 1993-01-01 1.4775 25 1994-01-01 1.5665 26 1995-01-01 1.5535 27 1996-01-01 1.7123 28 1997-01-01 - 1.6427 29 1998-01-01 1.6628 30 1999-01-01 1.6150 bond prices date price 2010-01-01 $100.55 2011-01-01 $100.93 2012-01-01 $86.70 2013-01-01 $100.61 2014-01-01 $105.78 2015-01-01 $121.47 2016-01-01 $130.43 2017-01-01 $111.08 2018-01-01 $121.02 2019-01-01 $112.89 2020-01-01 $118.50 2021-01-01 $122.54 2022-01-01 $117.20 1.5 1.5 1.6 1.6 1.5 1.4 1.2 1.3 1.2 1.3 1. 1. 1.1 1 1 1 CO WNNS bond spreads Exchange rates Ready D 28 NO U 29 30 31 32 33 34 35 36 37 38 39 40 41 42 43 44 45 46 47 48 49 50 51 52 53 54 55 56 57 u au 980 M WWW A 1997-01-01 1998-01-01 1999-01-01 2000-01-01 2001-01-01 2002-01-01 2003-01-01 2004-01-01 2005-01-01 2006-01-01 2007-01-01 2008-01-01 2009-01-01 2010-01-01 2011-01-01 2012-01-01 2013-01-01 2014-01-01 2015-01-01 2016-01-01 2017-01-01 2018-01-01 2019-01-01 2020-01-01 2021-01-01 2022-01-01 1.6427 1.6628 1.6150 1.4955 1.4543 1.6095 1.7842 1.9160 1.7188 1.9586 1.9843 1.4619 1.6167 1.5392 1.5537 1.6262 1.6574 1.5578 1.4746 1.2337 1.3529 1.2763 1.3269 1.3662 1.3500 1.3828 bond prices bond spreads Exchange rate D E F G H verizon bond data maturity par coupon 2040 100 6.25 date price USD per GBP 2010-01-01 $100.55 1.5392 2011-01-01 $100.93 1.5537 2012-01-01 $86.70 1.6262 2013-01-01 $100.61 1.6574 2014-01-01 $105.78 1.5578 2015-01-01 $121.47 1.4746 2016-01-01 $130.43 1.2337 2017-01-01 $111.08 1.3529 2018-01-01 $121.02 1.2763 2019-01-01 $112.89 1.3269 2020-01-01 $118.50 1.3662 2021-01-01 $122.54 1.3500 2022-01-01 $117.20 1.3828 Exchange rates Calculate the yield to maturity for the bonds in the tab, "bond price". The par value for each bond is $100 and the coupon payments are annual. Ignore the months when determining the maturity, e.g. for Revlon it matures in 2027, so the number of periods is 5 years. Which bond has the highest yield? Go to the tab with "bond spreads". Determine the yield to maturity on these bonds using the spread. The spread is the difference (in basis points) between the YTM on a corporate bond minus the YTM on a comparable maturity Treasury. Spread =YTM Cory - YTM The Note 100 basis points equals 1%. So for Comcast 79 basis points is 79/100/100 which equals 0.79% The second division by hundred is to get it in a decimal format for Excel. The Treasury yileds have to be divided by 100 also. So a one year treasury yield of 0.852 is 0.852/100 or 0.852% If you don't do this then the numbers can't be used in the excel functions correctly. If don't have a comparable maturity Treasury rate then go up to the next highest, e.g. IBM bond matures in 9 years so use the 10 year Treasury rate. matures m 9 years so use the 10 year Treasury rate. Once you have the YTM calculate the price for each of the bonds. Which bond has the highest price? Why doesn't the highest price correspond to the lowest yield? Look at the "GPB exchange rate" tab. The exchange rates are matched up with the dates for Verizon's bond If an American investor bought this bond Jan 2010 and sold it Jan 2017 what would be the retum on the investment? If a British investor bought this bond Jan 2010 and sold it Jan 2017 what would be the return on the investment? Why the difference
Step by Step Solution
There are 3 Steps involved in it

Get step-by-step solutions from verified subject matter experts