

Question: Please show excel and matlab code. Using Excel create a graph of the following theoretical function for Lift of an airplane (Lift vs. Velocity) for
Please show excel and matlab code.
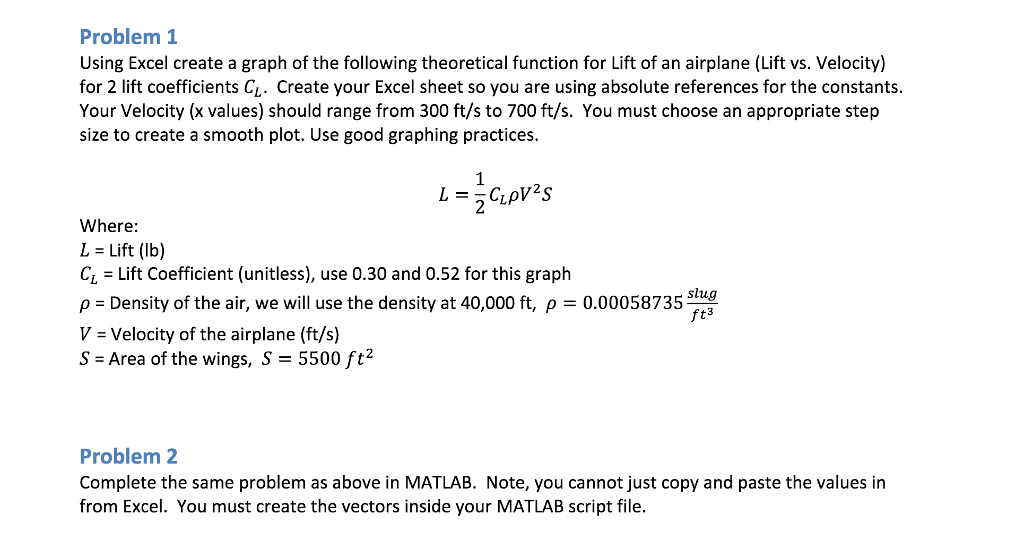
Using Excel create a graph of the following theoretical function for Lift of an airplane (Lift vs. Velocity) for 2 lift coefficients C_L. Create your Excel sheet so you are using absolute references for the constants.Your Velocity (x values) should range from 300 ft/s to 700 ft/s. You must choose an appropriate stepsize to create a smooth plot. Use good graphing practices. L = 1/2 C_LrhoV^2S Where: L = Lift (lb) C_L = Lift Coefficient (unitless), use 0.30 and 0.52 for this graph rho = Density of the air, we will use the density at 40,000 ft, rho = 0.00058735 slug/ft^3 V = Velocity of the airplane (ft/s) S = Area of the wings, S = 5500 ft^2 Complete the same problem as above in MATLAB. Note, you cannot just copy and paste the values in from Excel. You must create the vectors inside your MATLAB script file. Using Excel create a graph of the following theoretical function for Lift of an airplane (Lift vs. Velocity) for 2 lift coefficients C_L. Create your Excel sheet so you are using absolute references for the constants.Your Velocity (x values) should range from 300 ft/s to 700 ft/s. You must choose an appropriate stepsize to create a smooth plot. Use good graphing practices. L = 1/2 C_LrhoV^2S Where: L = Lift (lb) C_L = Lift Coefficient (unitless), use 0.30 and 0.52 for this graph rho = Density of the air, we will use the density at 40,000 ft, rho = 0.00058735 slug/ft^3 V = Velocity of the airplane (ft/s) S = Area of the wings, S = 5500 ft^2 Complete the same problem as above in MATLAB. Note, you cannot just copy and paste the values in from Excel. You must create the vectors inside your MATLAB script file
Step by Step Solution
There are 3 Steps involved in it

Get step-by-step solutions from verified subject matter experts