

Question: Problem 1 Using Excel create a graph of the following theoretical function for Lift of an airplane (Lift vs. Velocity) for 2 lift coefficients CL.
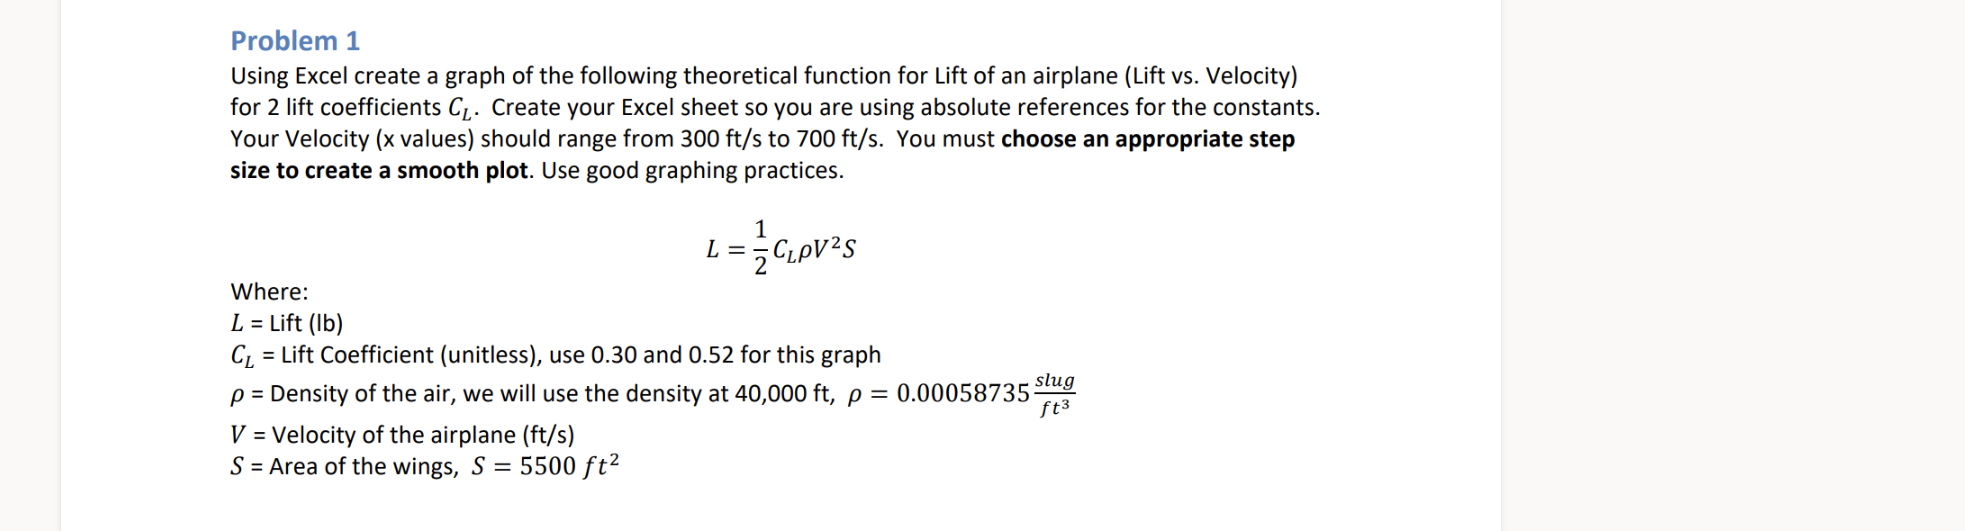
Problem 1 Using Excel create a graph of the following theoretical function for Lift of an airplane (Lift vs. Velocity) for 2 lift coefficients CL. Create your Excel sheet so you are using absolute references for the constants. Your Velocity (x values) should range from 300 ft/s to 700 ft/s, You must choose an appropriate step size to create a smooth plot. Use good graphing practices. 1 L:2 CLPVZS Where: L : Lift (lb) CL = Lift Coefficient (unltless), use 0.30 and 0.52 for this graph p : Density of the air, we will use the density at 40,000 ft, p = 000058735 V = Velocity of the airplane (ft/s) S = Area of the wings, S = 5500 ft2 slug ft3
Step by Step Solution
There are 3 Steps involved in it
1 Expert Approved Answer
Step: 1 Unlock

Question Has Been Solved by an Expert!
Get step-by-step solutions from verified subject matter experts
Step: 2 Unlock
Step: 3 Unlock