Question: please show excel calulations its project managment Assignment Your supervisor tells you to create a spreadsheet that can analyze the twentory quantity and ordering using
please
show excel calulations its project
managment
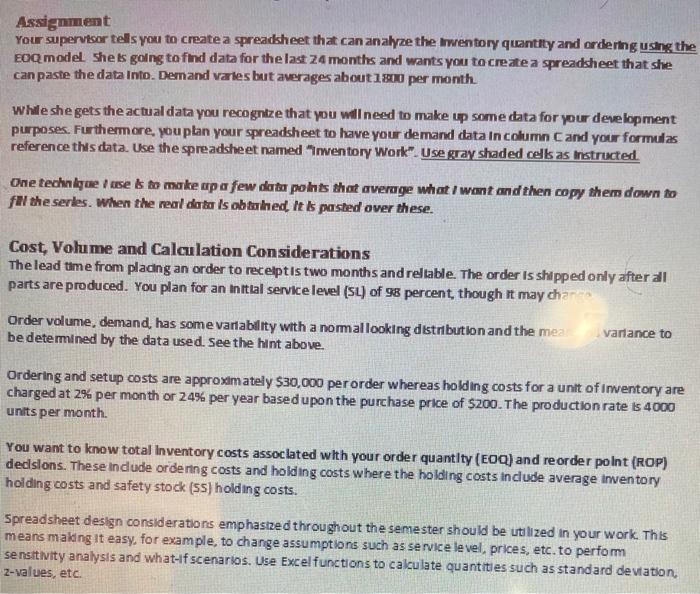
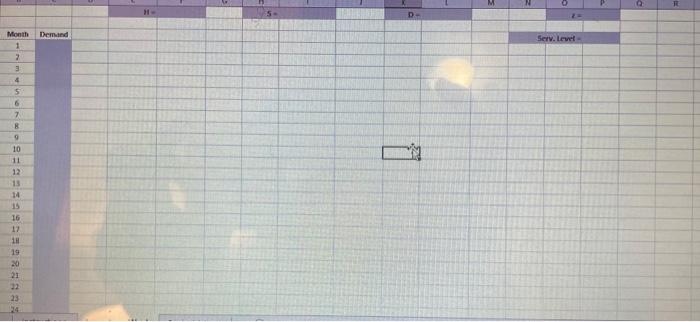
Assignment Your supervisor tells you to create a spreadsheet that can analyze the twentory quantity and ordering using the EOQ model she is going to find data for the last 24 months and wants you to create a spreadsheet that she can paste the data into. Demand varies but averages about 1500 per month while she gets the actual data you recognize that you will need to make up some data for your development purposes. Furthermore, you plan your spreadsheet to have your demand data in column C and your formulas reference this data. Use the spreadsheet named "Inwentory Work". Use gray shaded cells as instructed One technice se s to make up a few data points that average what I want and then copy them down to fly the serles. When the real data is obtained. It is posted over these. Cost, Volume and Calculation Considerations The lead time from pladng an order to receiptis two months and reliable. The order is shipped only after all parts are produced. You plan for an initial service level (SL) of 98 percent, though it may chana Order volume, demand, has some variability with a nomallooking distribution and the mea variance to be determined by the data used. See the hint above Ordering and setup costs are approximately $30,000 per order whereas holding costs for a unit of inventory are charged at 2% per month or 24% per year based upon the purchase price of $200. The production rate is 4000 units per month You want to know total Inventory costs associated with your order quantity (EQ) and reorder point (ROP) dedsions. These indude ordering costs and holding costs where the holding costs include average Inventory holding costs and safety stock (55) holding costs. Spreadsheet design considerations emphasized throughout the semester should be utilized in your work. This means making it easy, for example, to change assumptions such as service level, prices, etc. to perfom sensitivity analysis and what if scenarios. Use Excel functions to calculate quantities such as standard deviation, 2-values, etc. D Demand Serv. Level Month 1 2 3 4 5 6 7 B 9 10 11 12 13 14 15 16 17 18 19 20 21 32 23 Assignment Your supervisor tells you to create a spreadsheet that can analyze the twentory quantity and ordering using the EOQ model she is going to find data for the last 24 months and wants you to create a spreadsheet that she can paste the data into. Demand varies but averages about 1500 per month while she gets the actual data you recognize that you will need to make up some data for your development purposes. Furthermore, you plan your spreadsheet to have your demand data in column C and your formulas reference this data. Use the spreadsheet named "Inwentory Work". Use gray shaded cells as instructed One technice se s to make up a few data points that average what I want and then copy them down to fly the serles. When the real data is obtained. It is posted over these. Cost, Volume and Calculation Considerations The lead time from pladng an order to receiptis two months and reliable. The order is shipped only after all parts are produced. You plan for an initial service level (SL) of 98 percent, though it may chana Order volume, demand, has some variability with a nomallooking distribution and the mea variance to be determined by the data used. See the hint above Ordering and setup costs are approximately $30,000 per order whereas holding costs for a unit of inventory are charged at 2% per month or 24% per year based upon the purchase price of $200. The production rate is 4000 units per month You want to know total Inventory costs associated with your order quantity (EQ) and reorder point (ROP) dedsions. These indude ordering costs and holding costs where the holding costs include average Inventory holding costs and safety stock (55) holding costs. Spreadsheet design considerations emphasized throughout the semester should be utilized in your work. This means making it easy, for example, to change assumptions such as service level, prices, etc. to perfom sensitivity analysis and what if scenarios. Use Excel functions to calculate quantities such as standard deviation, 2-values, etc. D Demand Serv. Level Month 1 2 3 4 5 6 7 B 9 10 11 12 13 14 15 16 17 18 19 20 21 32 23