

Question: Please show excel formula and solver analysis. Please also highlight the answers for each question to be easier to follow In example 7.1 Pricing Decision
Please show excel formula and solver analysis. Please also highlight the answers for each question to be easier to follow
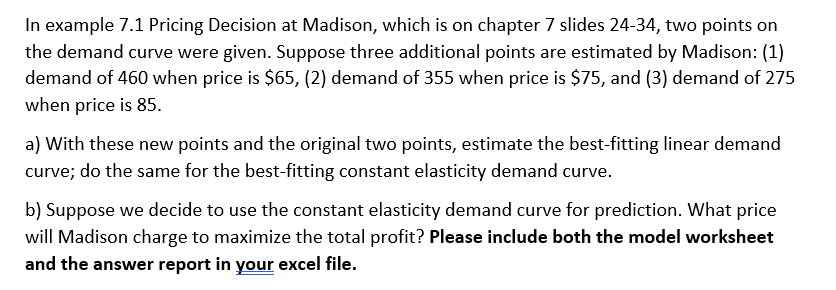
In example 7.1 Pricing Decision at Madison, which is on chapter 7 slides 24-34, two points on the demand curve were given. Suppose three additional points are estimated by Madison: (1) demand of 460 when price is $65, (2) demand of 355 when price is $75, and (3) demand of 275 when price is 85. a) With these new points and the original two points, estimate the best-fitting linear demand curve; do the same for the best-fitting constant elasticity demand curve. b) Suppose we decide to use the constant elasticity demand curve for prediction. What price will Madison charge to maximize the total profit? Please include both the model worksheet and the answer report in your excel fileStep by Step Solution
There are 3 Steps involved in it
1 Expert Approved Answer
Step: 1 Unlock

Question Has Been Solved by an Expert!
Get step-by-step solutions from verified subject matter experts
Step: 2 Unlock
Step: 3 Unlock