

Question: Please show Excel formulas Accessibility tab summary: Given Information for this question is presented in rows 2 through 8. Requirement Information is prese B D
Please show Excel formulas
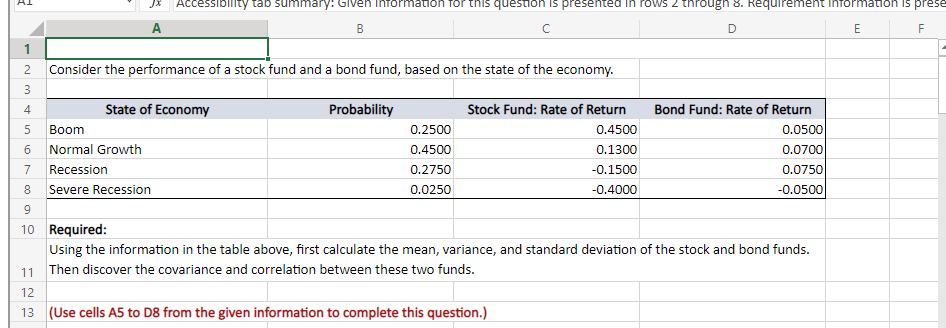
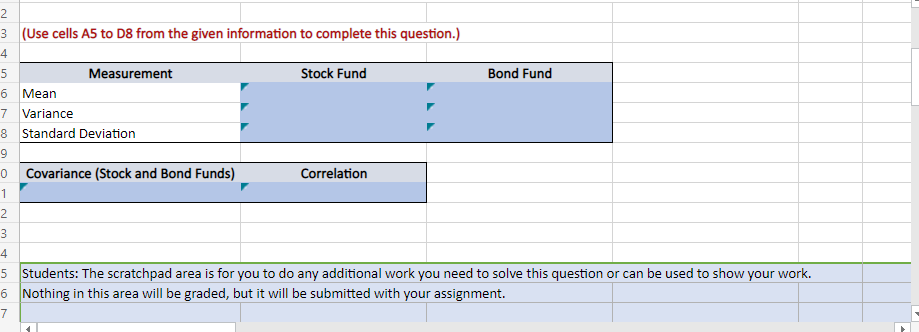
Accessibility tab summary: Given Information for this question is presented in rows 2 through 8. Requirement Information is prese B D E F 1 2 Consider the performance of a stock fund and a bond fund, based on the state of the economy. 3 4 4 Probability 5 6 State of Economy Boom Normal Growth Recession Severe Recession 0.2500 0.4500 0.2750 0.0250 Stock Fund: Rate of Return 0.4500 0.1300 -0.1500 -0.4000 Bond Fund: Rate of Return 0.0500 0.0700 0.0750 -0.0500 7 8 8 9 10 Required: Using the information in the table above, first calculate the mean, variance, and standard deviation of the stock and bond funds. 11 Then discover the covariance and correlation between these two funds. 12 13 (Use cells A5 to D8 from the given information to complete this question.) Bond Fund 2 3 (Use cells A5 to D8 from the given information to complete this question.) 4 5 Measurement Stock Fund 6 Mean 7 Variance 8 Standard Deviation 9 0 Covariance (Stock and Bond Funds) Correlation 1 2 3 4 5 Students: The scratchpad area is for you to do any additional work you need to solve this question or can be used to show your work. 6 Nothing in this area will be graded, but it will be submitted with your assignment. 7 Accessibility tab summary: Given Information for this question is presented in rows 2 through 8. Requirement Information is prese B D E F 1 2 Consider the performance of a stock fund and a bond fund, based on the state of the economy. 3 4 4 Probability 5 6 State of Economy Boom Normal Growth Recession Severe Recession 0.2500 0.4500 0.2750 0.0250 Stock Fund: Rate of Return 0.4500 0.1300 -0.1500 -0.4000 Bond Fund: Rate of Return 0.0500 0.0700 0.0750 -0.0500 7 8 8 9 10 Required: Using the information in the table above, first calculate the mean, variance, and standard deviation of the stock and bond funds. 11 Then discover the covariance and correlation between these two funds. 12 13 (Use cells A5 to D8 from the given information to complete this question.) Bond Fund 2 3 (Use cells A5 to D8 from the given information to complete this question.) 4 5 Measurement Stock Fund 6 Mean 7 Variance 8 Standard Deviation 9 0 Covariance (Stock and Bond Funds) Correlation 1 2 3 4 5 Students: The scratchpad area is for you to do any additional work you need to solve this question or can be used to show your work. 6 Nothing in this area will be graded, but it will be submitted with your assignment. 7
Step by Step Solution
There are 3 Steps involved in it

Get step-by-step solutions from verified subject matter experts