

Question: *** Please show excel formulas*** Consider the following information. Your portfolio is invested 30 percent each in A and C, and 40 percent in B.
*** Please show excel formulas***
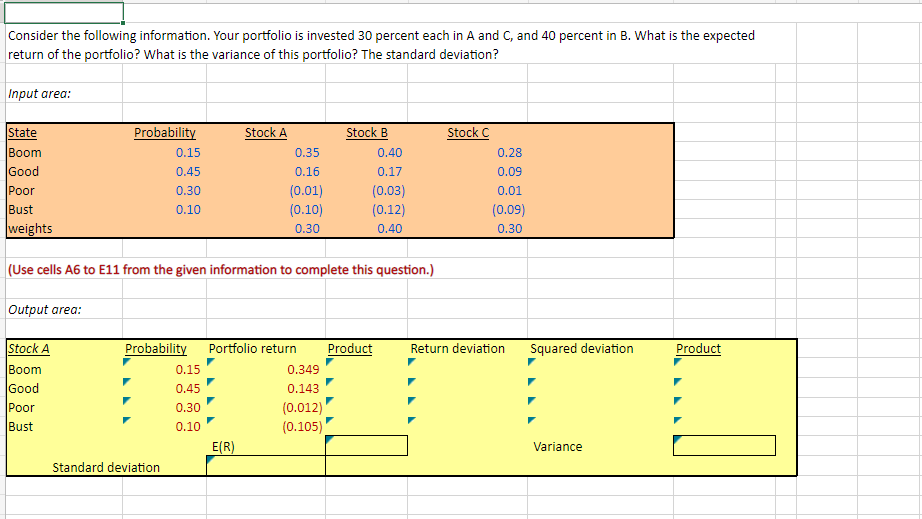
Consider the following information. Your portfolio is invested 30 percent each in A and C, and 40 percent in B. What is the expected return of the portfolio? What is the variance of this portfolio? The standard deviation? Input area: Stock C State Boom Good Poor Bust weights Probability 0.15 0.45 0.30 0.10 0.28 0.09 Stock A 0.35 0.16 (0.01) (0.10) 0.30 Stock B 0.40 0.17 (0.03) (0.12) 0.40 0.01 (0.09) 0.30 (Use cells A6 to E11 from the given information to complete this question.) Output area: Return deviation Squared deviation Product Stock A Probability Portfolio return Product Boom 0.15 0.349 Good 0.45 0.143 Poor 0.30 (0.012) Bust 0.10 (0.105) E(R) Standard deviation Variance
Step by Step Solution
There are 3 Steps involved in it

Get step-by-step solutions from verified subject matter experts