

Question: please show excel formulas with all work given Question Set 1. You are an inventory management consultant. You have been hired by Walmart to help
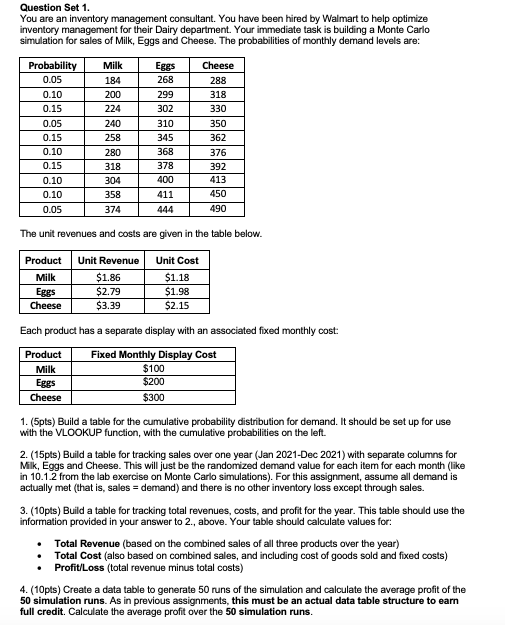 please show excel formulas with all work given
Step by Step Solution
There are 3 Steps involved in it
1 Expert Approved Answer
Step: 1 Unlock

Question Has Been Solved by an Expert!
Get step-by-step solutions from verified subject matter experts
Step: 2 Unlock
Step: 3 Unlock