Question: PLEASE SHOW EXCEL FUNCTION AND REFERENCE. Thanks in advance! How do we create a weighted average? Each datum is calculated by multiplying it by a
PLEASE SHOW EXCEL FUNCTION AND REFERENCE. Thanks in advance! 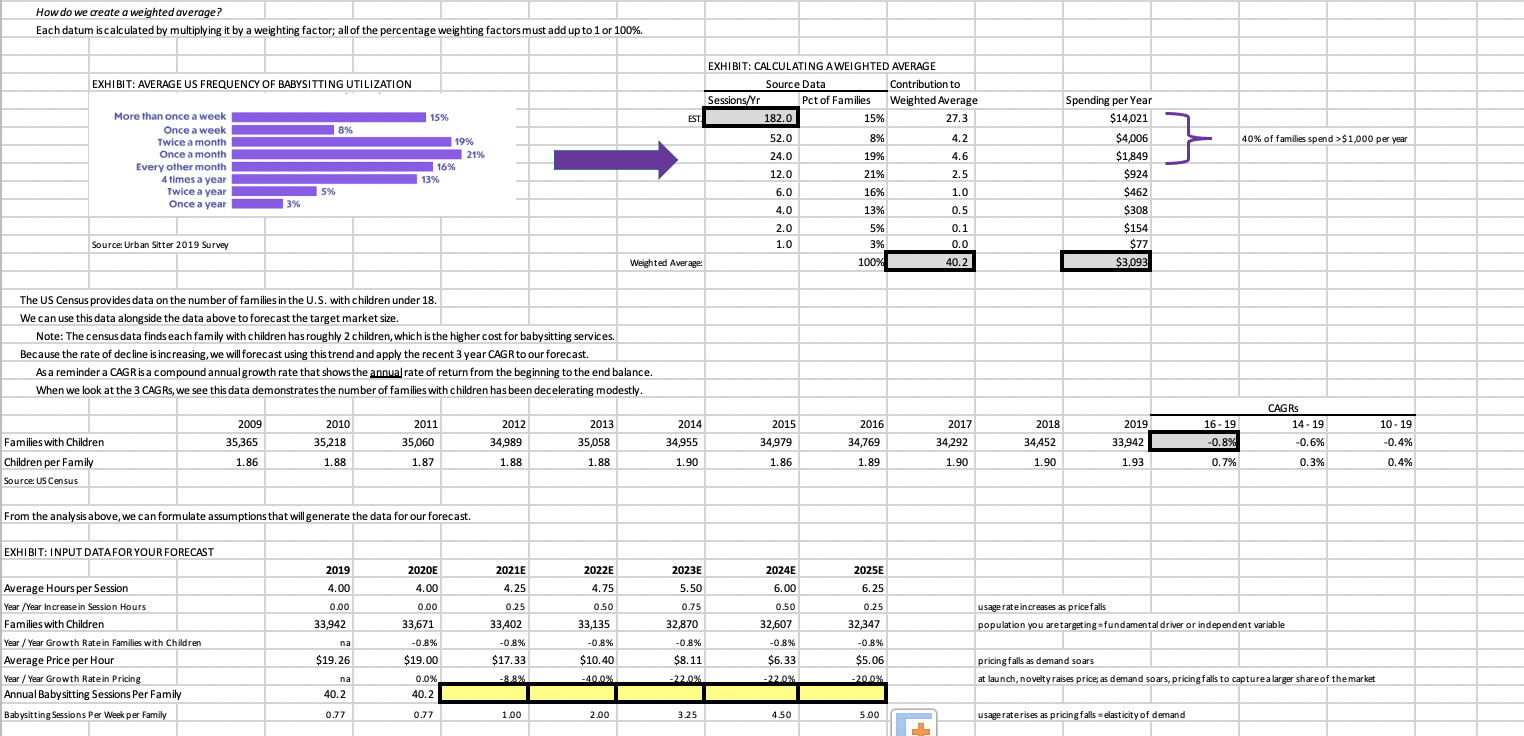
How do we create a weighted average? Each datum is calculated by multiplying it by a weighting factor; all of the percentage weighting factors must add up to 1 or 100%. EXHIBIT: AVERAGE US FREQUENCY OF BABYSITTING UTILIZATION EXHIBIT: CALCULATING A WEIGHTED AVERAGE Source Data Contribution to Sessions/Yr Pct of Families Weighted Average 182.0 15% 27.3 15% EST. 8% 4.2 40% of families spend >$1,000 per year More than once a week a Once a week Twice a month Once a month Every other month 4 times a year Twice a year Once a year a 19% 21% 16% 13% 52.0 24.0 5% 12.0 6.0 4.0 2.0 1.0 3% Spending per Year $14,021 $4,006 $1849 $924 $462 $308 $154 $77 $3,093 8% 19% 21% 16% 13% 5% 3% 100% 4.6 2.5 1.0 0.5 0.1 0.0 Source: Urban Sitter 2019 Survey Weighted Average: 40.2 The US Census provides data on the number of families in the U.S. with children under 18. We can use this data alongside the data above to forecast the target market size. Note: The census data finds each family with children has roughly 2 children, which is the higher cost for babysitting services. Because the rate of decline is increasing, we will forecast using this trend and apply the recent 3 year CAGR to our forecast. As a reminder a CAGR is a compound annual growth rate that shows the annual rate of return from the beginning to the end balance. When we look at the 3 CAGRs, we see this data demonstrates the number of families with children has been decelerating modestly. 2011 2019 16-19 2009 35,365 2010 35,218 2012 34,989 2013 35,058 2014 34,955 2015 34,979 2016 34,769 2017 34,292 2018 34452 CAGRS 14-19 -0.6% 10 - 19 -0.4% 35,060 33,942 -0.8% Families with Children Children per Family Source: US Census : 1.86 1.88 1.87 1.88 1.88 1.90 1.86 1.89 1.90 1.90 1.93 0.7% 0.3% 0.4% From the analysis above, we can formulate assumptions that will generate the data for our forecast. EXHIBIT: INPUT DATA FOR YOUR FORECAST 2020E 2019 4.00 0.00 2021E 4.25 2022E 4.75 2024E 6.00 2025E 6.25 4.00 0.00 2023E 5.50 0.75 32,870 0.50 0.50 0.25 0.25 33402 usagerate increases as price falls population you are targeting fundamental driver or independent variable 33,942 32,347 33,135 -0.8% 32,607 -0.8% = Average Hours per Session Year /Year Increase in Session Hours Families with Children Year / Year Growth Ratein Families with Children / Average Price per Hour Year / Year Growth Rate in Pricing Annual Babysitting Sessions Per Family Babysitting Sessions Per Week per Family na $19.26 33,671 -0.8% $19.00 0.0% 40.2 -0.8% $17.33 $10.40 -40.0% -0.8% $8.11 -22.0% $6.33 22.0% -0.8% $5.06 -20.0% pricingfalls as demand soars at launch, novelty raises price; as demand soars, pricing falls to capture a larger share of the market na 40.2 0.77 0.77 1.00 2.00 3.25 4.50 5.00 usageraterises as pricing falls = elasticity of demand How do we create a weighted average? Each datum is calculated by multiplying it by a weighting factor; all of the percentage weighting factors must add up to 1 or 100%. EXHIBIT: AVERAGE US FREQUENCY OF BABYSITTING UTILIZATION EXHIBIT: CALCULATING A WEIGHTED AVERAGE Source Data Contribution to Sessions/Yr Pct of Families Weighted Average 182.0 15% 27.3 15% EST. 8% 4.2 40% of families spend >$1,000 per year More than once a week a Once a week Twice a month Once a month Every other month 4 times a year Twice a year Once a year a 19% 21% 16% 13% 52.0 24.0 5% 12.0 6.0 4.0 2.0 1.0 3% Spending per Year $14,021 $4,006 $1849 $924 $462 $308 $154 $77 $3,093 8% 19% 21% 16% 13% 5% 3% 100% 4.6 2.5 1.0 0.5 0.1 0.0 Source: Urban Sitter 2019 Survey Weighted Average: 40.2 The US Census provides data on the number of families in the U.S. with children under 18. We can use this data alongside the data above to forecast the target market size. Note: The census data finds each family with children has roughly 2 children, which is the higher cost for babysitting services. Because the rate of decline is increasing, we will forecast using this trend and apply the recent 3 year CAGR to our forecast. As a reminder a CAGR is a compound annual growth rate that shows the annual rate of return from the beginning to the end balance. When we look at the 3 CAGRs, we see this data demonstrates the number of families with children has been decelerating modestly. 2011 2019 16-19 2009 35,365 2010 35,218 2012 34,989 2013 35,058 2014 34,955 2015 34,979 2016 34,769 2017 34,292 2018 34452 CAGRS 14-19 -0.6% 10 - 19 -0.4% 35,060 33,942 -0.8% Families with Children Children per Family Source: US Census : 1.86 1.88 1.87 1.88 1.88 1.90 1.86 1.89 1.90 1.90 1.93 0.7% 0.3% 0.4% From the analysis above, we can formulate assumptions that will generate the data for our forecast. EXHIBIT: INPUT DATA FOR YOUR FORECAST 2020E 2019 4.00 0.00 2021E 4.25 2022E 4.75 2024E 6.00 2025E 6.25 4.00 0.00 2023E 5.50 0.75 32,870 0.50 0.50 0.25 0.25 33402 usagerate increases as price falls population you are targeting fundamental driver or independent variable 33,942 32,347 33,135 -0.8% 32,607 -0.8% = Average Hours per Session Year /Year Increase in Session Hours Families with Children Year / Year Growth Ratein Families with Children / Average Price per Hour Year / Year Growth Rate in Pricing Annual Babysitting Sessions Per Family Babysitting Sessions Per Week per Family na $19.26 33,671 -0.8% $19.00 0.0% 40.2 -0.8% $17.33 $10.40 -40.0% -0.8% $8.11 -22.0% $6.33 22.0% -0.8% $5.06 -20.0% pricingfalls as demand soars at launch, novelty raises price; as demand soars, pricing falls to capture a larger share of the market na 40.2 0.77 0.77 1.00 2.00 3.25 4.50 5.00 usageraterises as pricing falls = elasticity of demand


