

Question: Please show formula using excel A2 X V fx Income Statement A B C D 1 2 Income Statement 3 All figures in millions of
Please show formula using excel
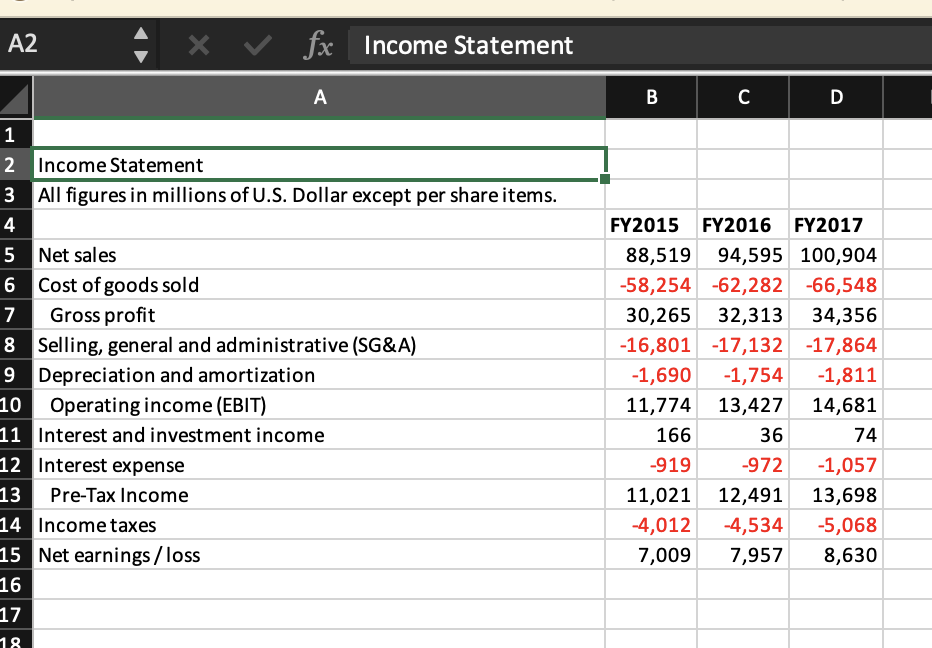
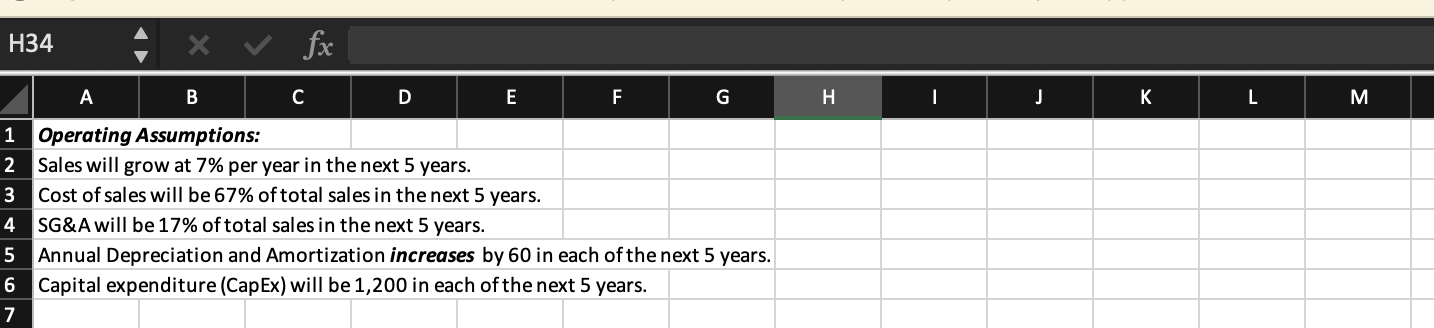
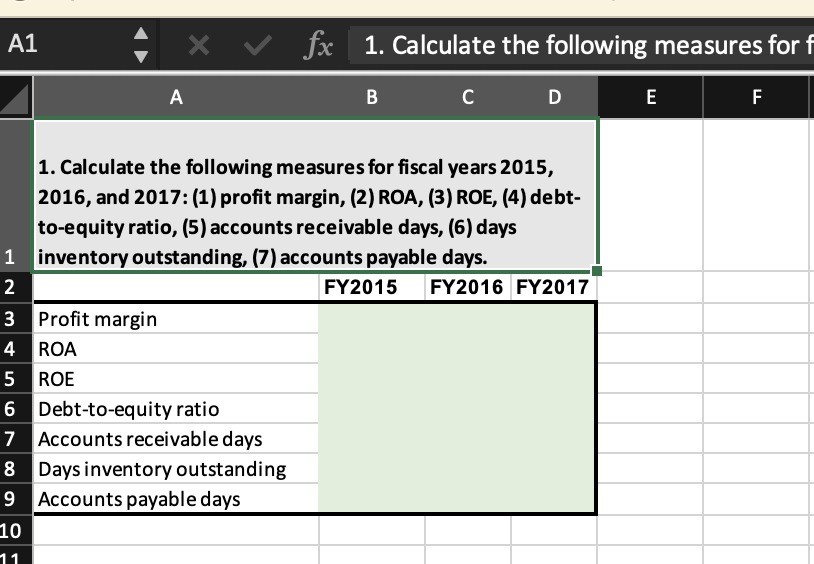
A2 X V fx Income Statement A B C D 1 2 Income Statement 3 All figures in millions of U.S. Dollar except per share items. 4 5 Net sales 6 Cost of goods sold 7 Gross profit 8 Selling, general and administrative (SG&A) 9 Depreciation and amortization 10 Operating income (EBIT) 11 Interest and investment income 12 Interest expense 13 Pre-Tax Income 14 Income taxes 15 Net earnings /loss 16 17 FY2015 FY2016 FY2017 88,519 94,595 100,904 -58,254 -62,282 -66,548 30,265 32,313 34,356 -16,801 -17,132 -17,864 -1,690 -1,754 -1,811 11,774 13,427 14,681 166 36 74 -919 -972 -1,057 11,021 12,491 13,698 -4,012 -4,534 -5,068 7,009 7,957 8,630 18 H34 fx A B C D E F G . I J K L M 1 Operating Assumptions: 2 Sales will grow at 7% per year in the next 5 years. 3 Cost of sales will be 67% of total sales in the next 5 years. 4 SG&A will be 17% of total sales in the next 5 years. 5 Annual Depreciation and Amortization increases by 60 in each of the next 5 years. 6 Capital expenditure (CapEx) will be 1,200 in each of the next 5 years. 7 A1 x v fx X fx 1. Calculate the following measures for f f A B D E F 1. Calculate the following measures for fiscal years 2015, 2016, and 2017: (1) profit margin, (2) ROA, (3) ROE, (4) debt- to-equity ratio, (5) accounts receivable days, (6) days 1 inventory outstanding, (7) accounts payable days. 2 FY2015 FY2016 FY2017 3 Profit margin 4 ROA 5 ROE 6 Debt-to-equity ratio 7 Accounts receivable days 8 Days inventory outstanding 9 Accounts payable days 10 11 A2 X V fx Income Statement A B C D 1 2 Income Statement 3 All figures in millions of U.S. Dollar except per share items. 4 5 Net sales 6 Cost of goods sold 7 Gross profit 8 Selling, general and administrative (SG&A) 9 Depreciation and amortization 10 Operating income (EBIT) 11 Interest and investment income 12 Interest expense 13 Pre-Tax Income 14 Income taxes 15 Net earnings /loss 16 17 FY2015 FY2016 FY2017 88,519 94,595 100,904 -58,254 -62,282 -66,548 30,265 32,313 34,356 -16,801 -17,132 -17,864 -1,690 -1,754 -1,811 11,774 13,427 14,681 166 36 74 -919 -972 -1,057 11,021 12,491 13,698 -4,012 -4,534 -5,068 7,009 7,957 8,630 18 H34 fx A B C D E F G . I J K L M 1 Operating Assumptions: 2 Sales will grow at 7% per year in the next 5 years. 3 Cost of sales will be 67% of total sales in the next 5 years. 4 SG&A will be 17% of total sales in the next 5 years. 5 Annual Depreciation and Amortization increases by 60 in each of the next 5 years. 6 Capital expenditure (CapEx) will be 1,200 in each of the next 5 years. 7 A1 x v fx X fx 1. Calculate the following measures for f f A B D E F 1. Calculate the following measures for fiscal years 2015, 2016, and 2017: (1) profit margin, (2) ROA, (3) ROE, (4) debt- to-equity ratio, (5) accounts receivable days, (6) days 1 inventory outstanding, (7) accounts payable days. 2 FY2015 FY2016 FY2017 3 Profit margin 4 ROA 5 ROE 6 Debt-to-equity ratio 7 Accounts receivable days 8 Days inventory outstanding 9 Accounts payable days 10 11
Step by Step Solution
There are 3 Steps involved in it

Get step-by-step solutions from verified subject matter experts