

Question: please show formulas 1984 1985 102 103 Problem 2: The following table shows the historical retums for large company stocks from 1980-1999. Let's find the
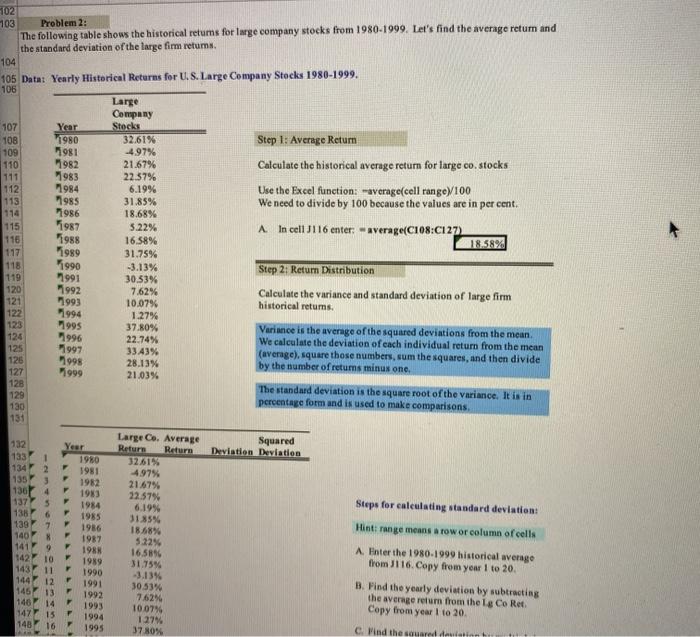
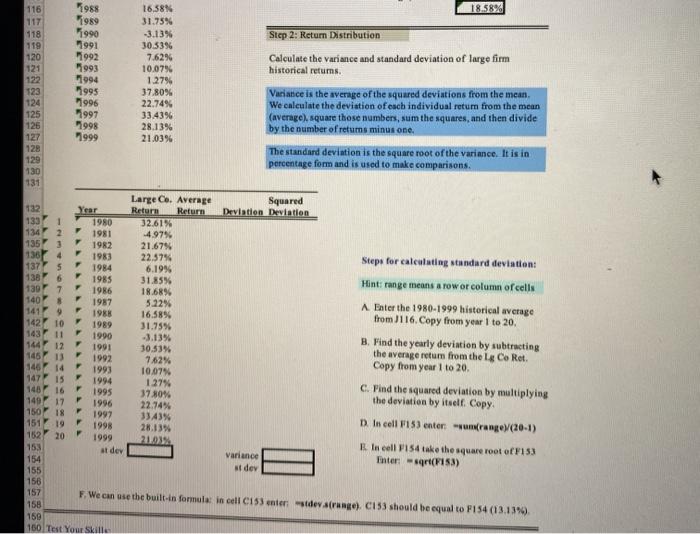
1984 1985 102 103 Problem 2: The following table shows the historical retums for large company stocks from 1980-1999. Let's find the average return and the standard deviation of the large fim retums. 104 105 Data: Yearly Historical Returns for U.S. Large Company Stocks 1980-1999. 106 Large Company 107 Year Stocks 108 1980 32,61% Step 1: Average Return 109 1981 -497% 110 1982 21.67% Calculate the historical average return for large co stocks 111 983 22.57% 112 6.19% Use the Excel function: average(cell range 100 113 31.85% We need to divide by 100 because the values are in per cent. 114 1986 18.68% 115 5.22% A. In cell J116 enter: -average(C108:C127) 116 1988 16.58% 18.58% 117 1989 31.75% 118 1990 -3.13% Step 2: Return Distribution 119 30.53% 120 7.62% Calculate the variance and standard deviation of large firm 121 10.079 historical retums. 122 1.27% 123 37.80% Variance is the average of the squared deviations from the mean 124 1996 22.74% We calculate the deviation of each individual return from the mean 125 3343% (average),square those numbers, sum the squares, and then divide 126 28.13% by the number of returns minus one. 127 1999 21.03% 128 The standard deviation is the square root of the variance. It is in 129 percentage form and is used to make comparisons 131 1987 1991 1992 1993 1994 1995 1997 1998 130 Squared Deviation Deviation 134 Year 1980 1981 1982 1983 1984 Large Co. Average Return Return 3261% 497% 21.67% 22.57% 6.19% 31.8596 18.68% 5.22% 16.5896 31.75% Steps for calculating standard deviation: 132 133 1 2 135 136 137 136 139 140 141 142 10 1437 11 144 145 146 14 147 15 148 1985 Hints range means a row or column of cells A Enter the 1980-1999 historical average from 116. Copy from year 1 to 20 1986 1987 1988 1989 1990 1991 1992 1993 1994 1995 30.53% 76294 100774 1.27% 37.80% B. Find the yearly deviation by subtracting the average return from the Lg Co Ret Copy from year I to 20 c Pind the squareddaulatin 129 1982 116 1988 16.58% 18.58% 117 1989 31.75% 118 1990 -3.13% Step 2: Return Distribution 119 1991 30.53% 120 1992 7.62% Calculate the variance and standard deviation of large firm 121 1993 10.0794 historical returns. 122 1994 1.279 123 1995 37.80% Variance is the average of the squared deviations from the mean. 124 1996 22.74% We calculate the deviation of each individual return from the mean 125 1997 33.4396 (average), square those numbers, sum the squares, and then divide 126 1998 28.13% by the number of retums minus one, 127 1999 21.03% 128 The standard deviation is the square root of the variance. It is in percentage form and is used to make comparisons 130 131 Large C. Average Squared Year Return Return Deviation Deviation 133 1 1980 32.61% 134 2 1981 -4.97% 135 3 21.67% 136 4 1983 22.57% Steps for calculating standard deviation: 137 5 6.19% 1386 1985 31.85% Hint range means a row or column of cells 130 7 18.6896 140 8 5.22% A Enter the 1980-1999 historical average 141 9 16.58% from J116. Copy from year 1 to 20 10 1989 31.7596 143 11 F 1990 -3.13% B. Find the yearly deviation by subtracting 144 12 1991 30.53% the average retum from the Lg Co Ret. 145 13 1992 7.62% 146 14 1993 Copy from year 1 to 20 10.07% 147 15 1994 1.27 140 16 1995 37.80% C. Find the squared deviation by multiplying 149 17 F the deviation by itself. Copy 1996 22.74% 150 18 3343% 151 19 1998 28.13% D. In cell F15) enter urange (20-1) 152 20 1999 2009 153 E. In cell F154 take the square root of F153 adev variance 154 Inter - (F153) dev 155 158 157 F. We can use the built-in formula is cell C153 enter de strange), C153 should be equal to F154 (13.13%) 158 159 160 Test Your Skill 1984 1986 1987 1988 142 1997
Step by Step Solution
There are 3 Steps involved in it

Get step-by-step solutions from verified subject matter experts