

Question: Problem 2: The following table shows the historical returns for large company stocks from 1985-1999. Let's find the average retum and the standard deviation of
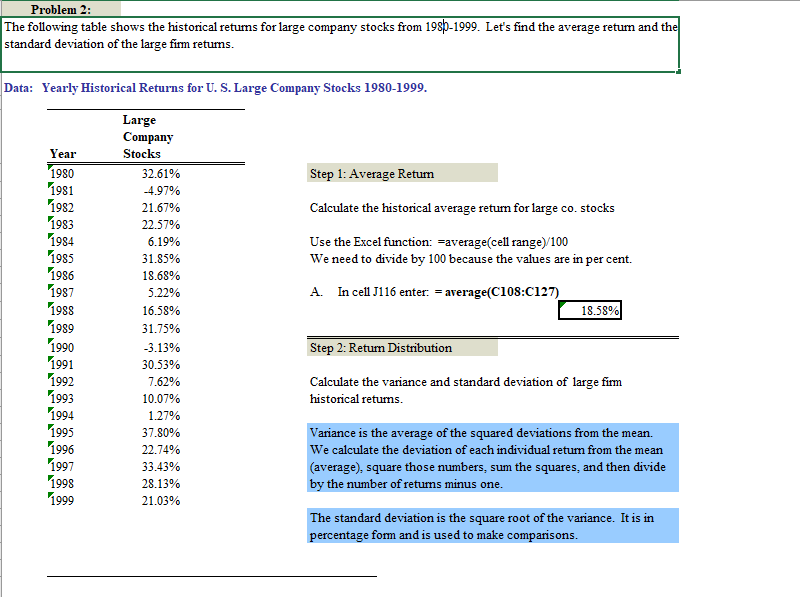
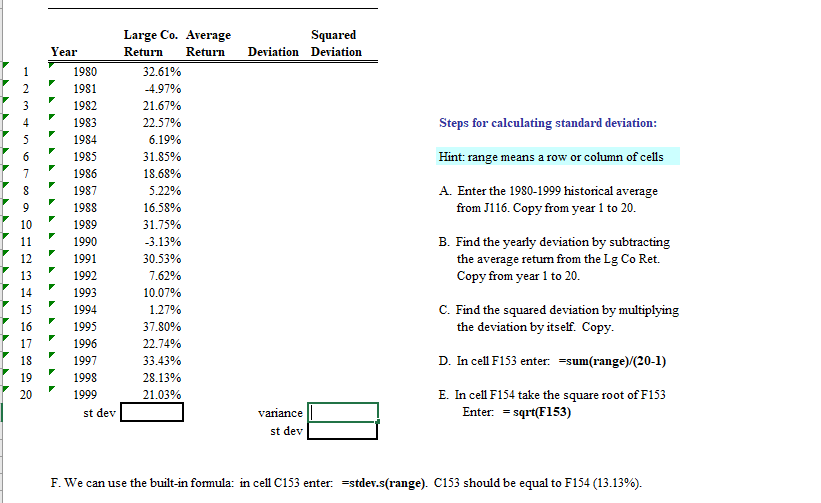
Problem 2: The following table shows the historical returns for large company stocks from 1985-1999. Let's find the average retum and the standard deviation of the large firm retums. Data: Yearly Historical Returns for U. S. Large Company Stocks 1980-1999. Large Company Stocks Step 1: Average Return Calculate the historical average retum for large co. stocks Use the Excel function: -average(cell range) 100 We need to divide by 100 because the values are in per cent. A. In cell J116 enter: = average(C108:C127) 18.58% Year 1980 1981 1982 1983 1984 1985 1986 1987 1988 1989 1990 1991 1992 1993 1994 1995 1996 1997 "1998 1999 32.61% -4.97% 21.67% 22.57% 6.19% 31.85% 18.68% 5.22% 16.58% 31.75% -3.13% 30.53% 7.62% 10.07% 1.27% 37.80% 22.74% 33.43% 28.13% 21.03% Step 2: Return Distribution Calculate the variance and standard deviation of large firm historical retums. Variance is the average of the squared deviations from the mean. We calculate the deviation of each individual return from the mean (average), square those numbers, sum the squares, and then divide by the number of retums minus one. The standard deviation is the square root of the variance. It is in percentage form and is used to make comparisons. Squared Deviation Deviation Year 3 Steps for calculating standard deviation: Hint: range means a row or column of cells 7 8 A. Enter the 1980-1999 historical average from J116. Copy from year 1 to 20. 9 10 Large Co. Average Return Return 32.61% 4.97% 21.67% 22.57% 6.19% 31.85% 18.68% 5.22% 16.58% 31.75% -3.13% 30.53% 7.62% 10.07% 1.27% 37.80% 22.74% 33.43% 28.13% 21.03% 1980 1981 1982 1983 1984 1985 1986 1987 1988 1989 1990 1991 1992 1993 1994 1995 1996 1997 1998 1999 st dev B. Find the yearly deviation by subtracting the average return from the Lg Co Ret. Copy from year 1 to 20. C. Find the squared deviation by multiplying the deviation by itself. Copy. 15 16 17 18 19 20 D. In cell F153 enter: =sum(range)/(20-1) E. In cell F154 take the square root of F153 Enter: = sqrt(F153) variance st dev F. We can use the built-in formula: in cell C153 enter. Estdev.s(range). C153 should be equal to F154 (13.13%)
Step by Step Solution
There are 3 Steps involved in it

Get step-by-step solutions from verified subject matter experts