

Question: please show formulas from 5-7 please Contribution margin per unit Break-even point in units Sales volume needed to reach a profit of $750,000 Now, apply
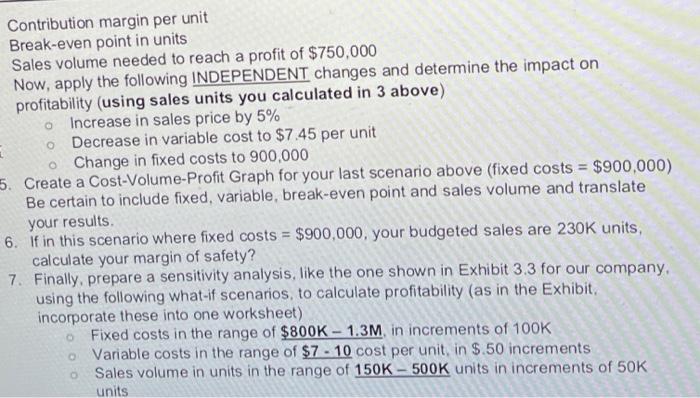
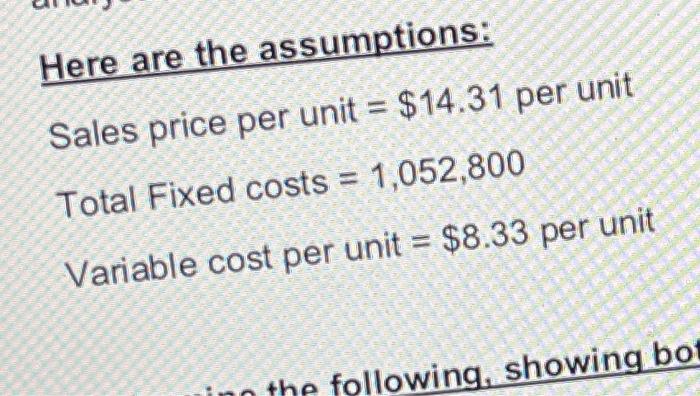
Contribution margin per unit Break-even point in units Sales volume needed to reach a profit of $750,000 Now, apply the following INDEPENDENT changes and determine the impact on profitability (using sales units you calculated in 3 above) Increase in sales price by 5% Decrease in variable cost to $7.45 per unit o Change in fixed costs to 900,000 5. Create a Cost-Volume-Profit Graph for your last scenario above (fixed costs = $900,000) Be certain to include fixed, variable, break-even point and sales volume and translate your results. 6. if in this scenario where fixed costs = $900,000, your budgeted sales are 230K units, calculate your margin of safety? 7. Finally, prepare a sensitivity analysis, like the one shown in Exhibit 3.3 for our company, using the following what-if scenarios, to calculate profitability (as in the Exhibit, incorporate these into one worksheet) Fixed costs in the range of $800K - 1.3M, in increments of 100K o Variable costs in the range of $7 - 10 cost per unit, in $.50 increments Sales volume in units in the range of 150K - 500K units in increments of 50K units Here are the assumptions: Sales price per unit = $14.31 per unit Total Fixed costs = 1,052,800 Variable cost per unit = $8.33 per unit in the following, showing bot
Step by Step Solution
There are 3 Steps involved in it

Get step-by-step solutions from verified subject matter experts