

Question: Please show formulas. Project III: Risk and Return For the file name follow the instruction in the syllabus Don't forget to complete the cover page
Please show formulas.
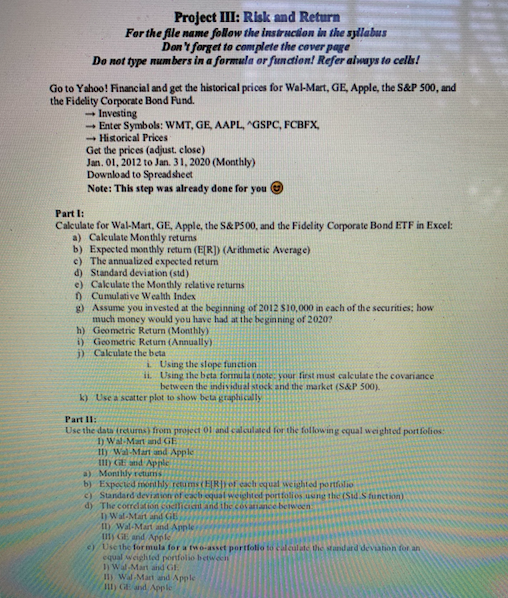
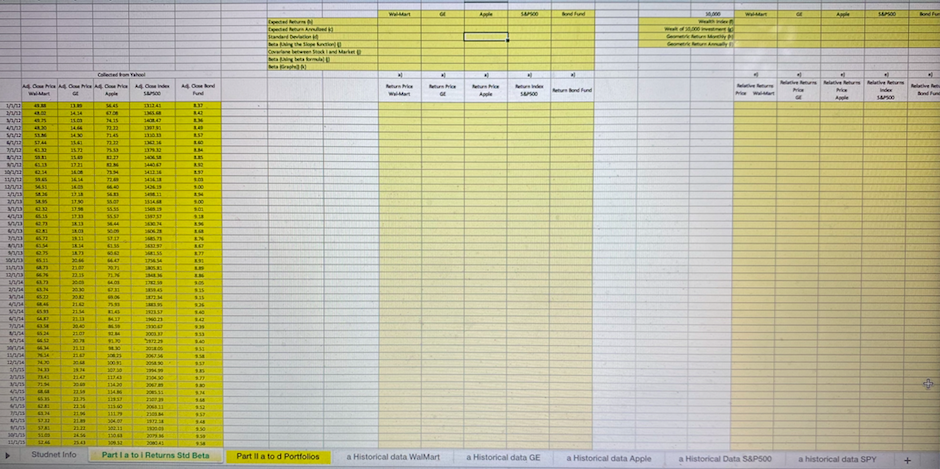
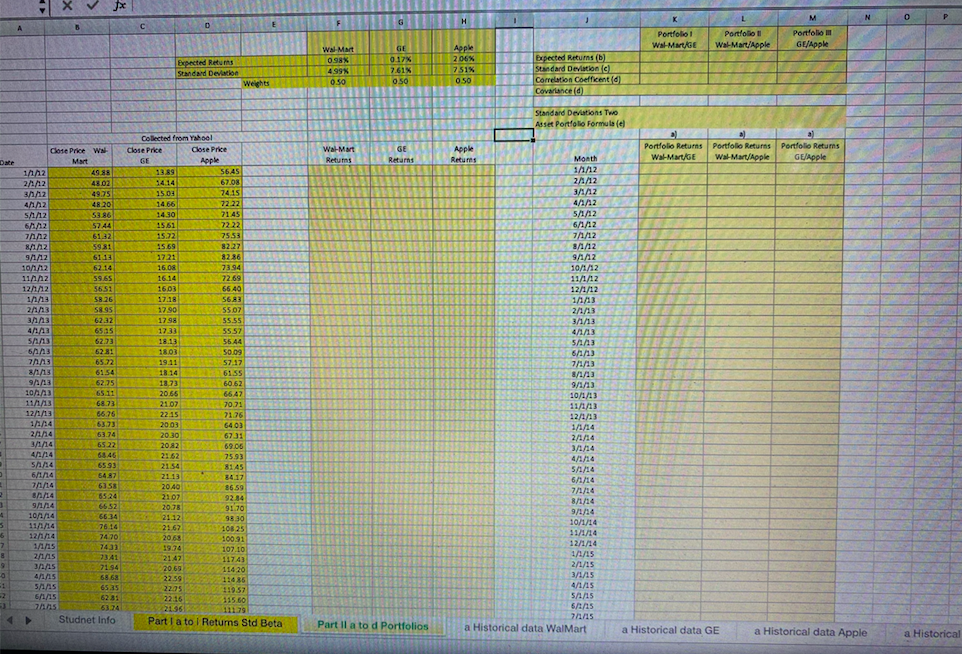
Project III: Risk and Return For the file name follow the instruction in the syllabus Don't forget to complete the cover page Do not type numbers in a formula or function! Refer always to cells! Go to Yahoo! Financial and get the historical prices for Wal-Mart, GE, Apple, the S&P 500, and the Fidelity Corporate Bond Pund. - Investing - Enter Symbols: WMT, GE, AAPL, GSPC, FCBFX, - Historical Prices Get the prices (adjust close) Jan. 01, 2012 to Jan. 31, 2020 (Monthly) Download to Spreadsheet Note: This step was already done for you Part I: Calculate for Wal-Mart, GE, Apple, the S&P500, and the Fidelity Corporate Bond ETF in Excel: a) Calculate Monthly returns b) Expected monthly retum (E[R]) (Arithmetic Average) c) The annualized expected retum d) Standard deviation (std) e) Calculate the Monthly relative returns 1) Cumulative Wealth Index g) Assume you invested at the beginning of 2012 $10,000 in each of the securities: how much money would you have had at the beginning of 2020? h) Geometric Return (Monthly) i) Geometric Return (Annually) i) Calculate the beta 1. Using the slope function ii. Using the beta formularnote: your first must calculate the covariance between the individual stock and the market (S&P 500). k) Use a scatter plot to show beta graphically Part II: Use the data freturns) from project and calculated for the following equal weighted portfolios 1) Wal-Mart and GE Il) Wal-Mart and Apple Illy GE and Apple a) Monthly returns b) Expected monthly retums(ELRY of each equal weighted portfolio c) Standard deviation of each equal weighted portfolios uong the (Sid S function) d) The correlation cacilicct and the cosce between 1) Wal-Mart and Gil II) Wal-Mart and Apple us CE and Apple Use the formula for a two-asset portfolio to calculate the standard devuhon for an equal weighted portfolio betweit 1 W. Mart and GE II) Wal-Mart and Apple Hul) GE and Apple GA SA Bordd HD . al . . 14. u 14. 4. Oeu Adinden Med Pud HI Ale SUS Band 722 TE wins 144 ELSE 10 TL 61 DESET 1721 CHE 19 T us W ME 112 NEL 200 w 1 30 w ET LE ISM U NE HE SEE 304 11 10 DE M SE ET LE Studnet Info Part I a to I Returns Std Beta Part il a to d Portfolios a Historical data Wal Mart a Historical data GE a Historical data Apple a Historical Data S&P500 a historical data SPY + J* K N o H F Portfolio 1 Ww.Marte L Portfolio Wal-Mart/Apple M Portfolio GE/Apple Expected Returns Standard Devilo WA Mort 098 499% 0.50 GE 0.17% 7.61% 0.50 Apple 206% 751% 050 Bxpected Returns (b) Standard Deviation (c) Correlation coefficent () Covariance Weights Standard Deviations Two Asset Portfolio Formula (el Wal-Mart Returns GE Returns Apple Returns a) Portfolio Returns Portfolio Returns Portfolio Returns Wal-Mart/GE Wal-Mart/Apple GE/Apple //3 Month 11/12 21/12 3/1/2 4/1/2 5/1/12 6/1/2 7/1/12 8/1/12 92 10/1/12 11/1/2 12/1/12 2/ ?/11 : Close Price W Mart 122 2AA2 43.02 49.75 42 48.20 SA12 53.86 612 5744 61.32 8/1/12 5931 9/1/12 61.13 10.12 62.14 59.65 12/11/2 56.51 11/13 58.26 2013 58.95 33 62.32 4AB 6535 5273 62.73 63 62 81 65.72 8/1/13 61.54 9/13 62.35 103 65.11 11/13 68.73 12/1/13 86.26 1174 63.33 2014 63.74 3/1/14 6522 4/14 68.46 SA 6593 6/14 5487 71/14 6358 6524 9714 6652 104 66.14 76.14 12/11/14 7470 1/1/15 7431 2/1/15 7341 31/15 71.94 411/15 68.68 5/1/15 6535 6/1/15 62 3: A5 63.74 Studnet Info Collected from Yahoo! Close Price Close Price Apple 1389 56.45 1414 67.08 1501 74.15 1466 72.22 14.30 71.45 15.61 7222 15.22 75.53 15.69 82.27 1721 82.86 16.08 73.94 16.14 72.69 16.03 66.40 1718 5683 17.90 5507 17.98 5555 17:33 5557 18.13 55.44 18.03 50.09 19.11 57.17 1R 14 6155 18.73 60.62 20.66 6647 21.07 70.71 22.15 21.76 2003 6403 20.30 67.31 20.82 69.06 21.62 2154 2113 3.4.17 2040 86.59 21.07 9284 20.31 9170 21.12 9830 21.67 10825 20.63 100.31 107.10 21.42 11743 ) 20.69 11420 22.59 1:436 22.05 119.57 22.16 115.60 21.36 Part I a to I Returns Std Beta 7593 2/1/13 3/1/13 4/1/13 5/1/3 6/1/13 7/1/13 8/1/13 9/1/13 10/1/13 11/1/13 12/1/13 1/1/14 2/1/14 3/1/14 4/1/14 5/1/14 6/1/14 7/1/14 8/1/14 9/174 10/1/14 11/1/14 12/1/14 1/1/15 2/1/15 3/1/15 4/1/15 5/1/15 6/1/15 7/1/15 a Historical data Walmart 3 7 8 2 Part Il a to d Portfolios a Historical data GE a Historical data Apple a Historical Project III: Risk and Return For the file name follow the instruction in the syllabus Don't forget to complete the cover page Do not type numbers in a formula or function! Refer always to cells! Go to Yahoo! Financial and get the historical prices for Wal-Mart, GE, Apple, the S&P 500, and the Fidelity Corporate Bond Pund. - Investing - Enter Symbols: WMT, GE, AAPL, GSPC, FCBFX, - Historical Prices Get the prices (adjust close) Jan. 01, 2012 to Jan. 31, 2020 (Monthly) Download to Spreadsheet Note: This step was already done for you Part I: Calculate for Wal-Mart, GE, Apple, the S&P500, and the Fidelity Corporate Bond ETF in Excel: a) Calculate Monthly returns b) Expected monthly retum (E[R]) (Arithmetic Average) c) The annualized expected retum d) Standard deviation (std) e) Calculate the Monthly relative returns 1) Cumulative Wealth Index g) Assume you invested at the beginning of 2012 $10,000 in each of the securities: how much money would you have had at the beginning of 2020? h) Geometric Return (Monthly) i) Geometric Return (Annually) i) Calculate the beta 1. Using the slope function ii. Using the beta formularnote: your first must calculate the covariance between the individual stock and the market (S&P 500). k) Use a scatter plot to show beta graphically Part II: Use the data freturns) from project and calculated for the following equal weighted portfolios 1) Wal-Mart and GE Il) Wal-Mart and Apple Illy GE and Apple a) Monthly returns b) Expected monthly retums(ELRY of each equal weighted portfolio c) Standard deviation of each equal weighted portfolios uong the (Sid S function) d) The correlation cacilicct and the cosce between 1) Wal-Mart and Gil II) Wal-Mart and Apple us CE and Apple Use the formula for a two-asset portfolio to calculate the standard devuhon for an equal weighted portfolio betweit 1 W. Mart and GE II) Wal-Mart and Apple Hul) GE and Apple GA SA Bordd HD . al . . 14. u 14. 4. Oeu Adinden Med Pud HI Ale SUS Band 722 TE wins 144 ELSE 10 TL 61 DESET 1721 CHE 19 T us W ME 112 NEL 200 w 1 30 w ET LE ISM U NE HE SEE 304 11 10 DE M SE ET LE Studnet Info Part I a to I Returns Std Beta Part il a to d Portfolios a Historical data Wal Mart a Historical data GE a Historical data Apple a Historical Data S&P500 a historical data SPY + J* K N o H F Portfolio 1 Ww.Marte L Portfolio Wal-Mart/Apple M Portfolio GE/Apple Expected Returns Standard Devilo WA Mort 098 499% 0.50 GE 0.17% 7.61% 0.50 Apple 206% 751% 050 Bxpected Returns (b) Standard Deviation (c) Correlation coefficent () Covariance Weights Standard Deviations Two Asset Portfolio Formula (el Wal-Mart Returns GE Returns Apple Returns a) Portfolio Returns Portfolio Returns Portfolio Returns Wal-Mart/GE Wal-Mart/Apple GE/Apple //3 Month 11/12 21/12 3/1/2 4/1/2 5/1/12 6/1/2 7/1/12 8/1/12 92 10/1/12 11/1/2 12/1/12 2/ ?/11 : Close Price W Mart 122 2AA2 43.02 49.75 42 48.20 SA12 53.86 612 5744 61.32 8/1/12 5931 9/1/12 61.13 10.12 62.14 59.65 12/11/2 56.51 11/13 58.26 2013 58.95 33 62.32 4AB 6535 5273 62.73 63 62 81 65.72 8/1/13 61.54 9/13 62.35 103 65.11 11/13 68.73 12/1/13 86.26 1174 63.33 2014 63.74 3/1/14 6522 4/14 68.46 SA 6593 6/14 5487 71/14 6358 6524 9714 6652 104 66.14 76.14 12/11/14 7470 1/1/15 7431 2/1/15 7341 31/15 71.94 411/15 68.68 5/1/15 6535 6/1/15 62 3: A5 63.74 Studnet Info Collected from Yahoo! Close Price Close Price Apple 1389 56.45 1414 67.08 1501 74.15 1466 72.22 14.30 71.45 15.61 7222 15.22 75.53 15.69 82.27 1721 82.86 16.08 73.94 16.14 72.69 16.03 66.40 1718 5683 17.90 5507 17.98 5555 17:33 5557 18.13 55.44 18.03 50.09 19.11 57.17 1R 14 6155 18.73 60.62 20.66 6647 21.07 70.71 22.15 21.76 2003 6403 20.30 67.31 20.82 69.06 21.62 2154 2113 3.4.17 2040 86.59 21.07 9284 20.31 9170 21.12 9830 21.67 10825 20.63 100.31 107.10 21.42 11743 ) 20.69 11420 22.59 1:436 22.05 119.57 22.16 115.60 21.36 Part I a to I Returns Std Beta 7593 2/1/13 3/1/13 4/1/13 5/1/3 6/1/13 7/1/13 8/1/13 9/1/13 10/1/13 11/1/13 12/1/13 1/1/14 2/1/14 3/1/14 4/1/14 5/1/14 6/1/14 7/1/14 8/1/14 9/174 10/1/14 11/1/14 12/1/14 1/1/15 2/1/15 3/1/15 4/1/15 5/1/15 6/1/15 7/1/15 a Historical data Walmart 3 7 8 2 Part Il a to d Portfolios a Historical data GE a Historical data Apple a Historical
Step by Step Solution
There are 3 Steps involved in it

Get step-by-step solutions from verified subject matter experts