

Question: Please show full steps as I don't know how to solve a question like this The following graph appeared in a local newspaper. 700 600
Please show full steps as I don't know how to solve a question like this
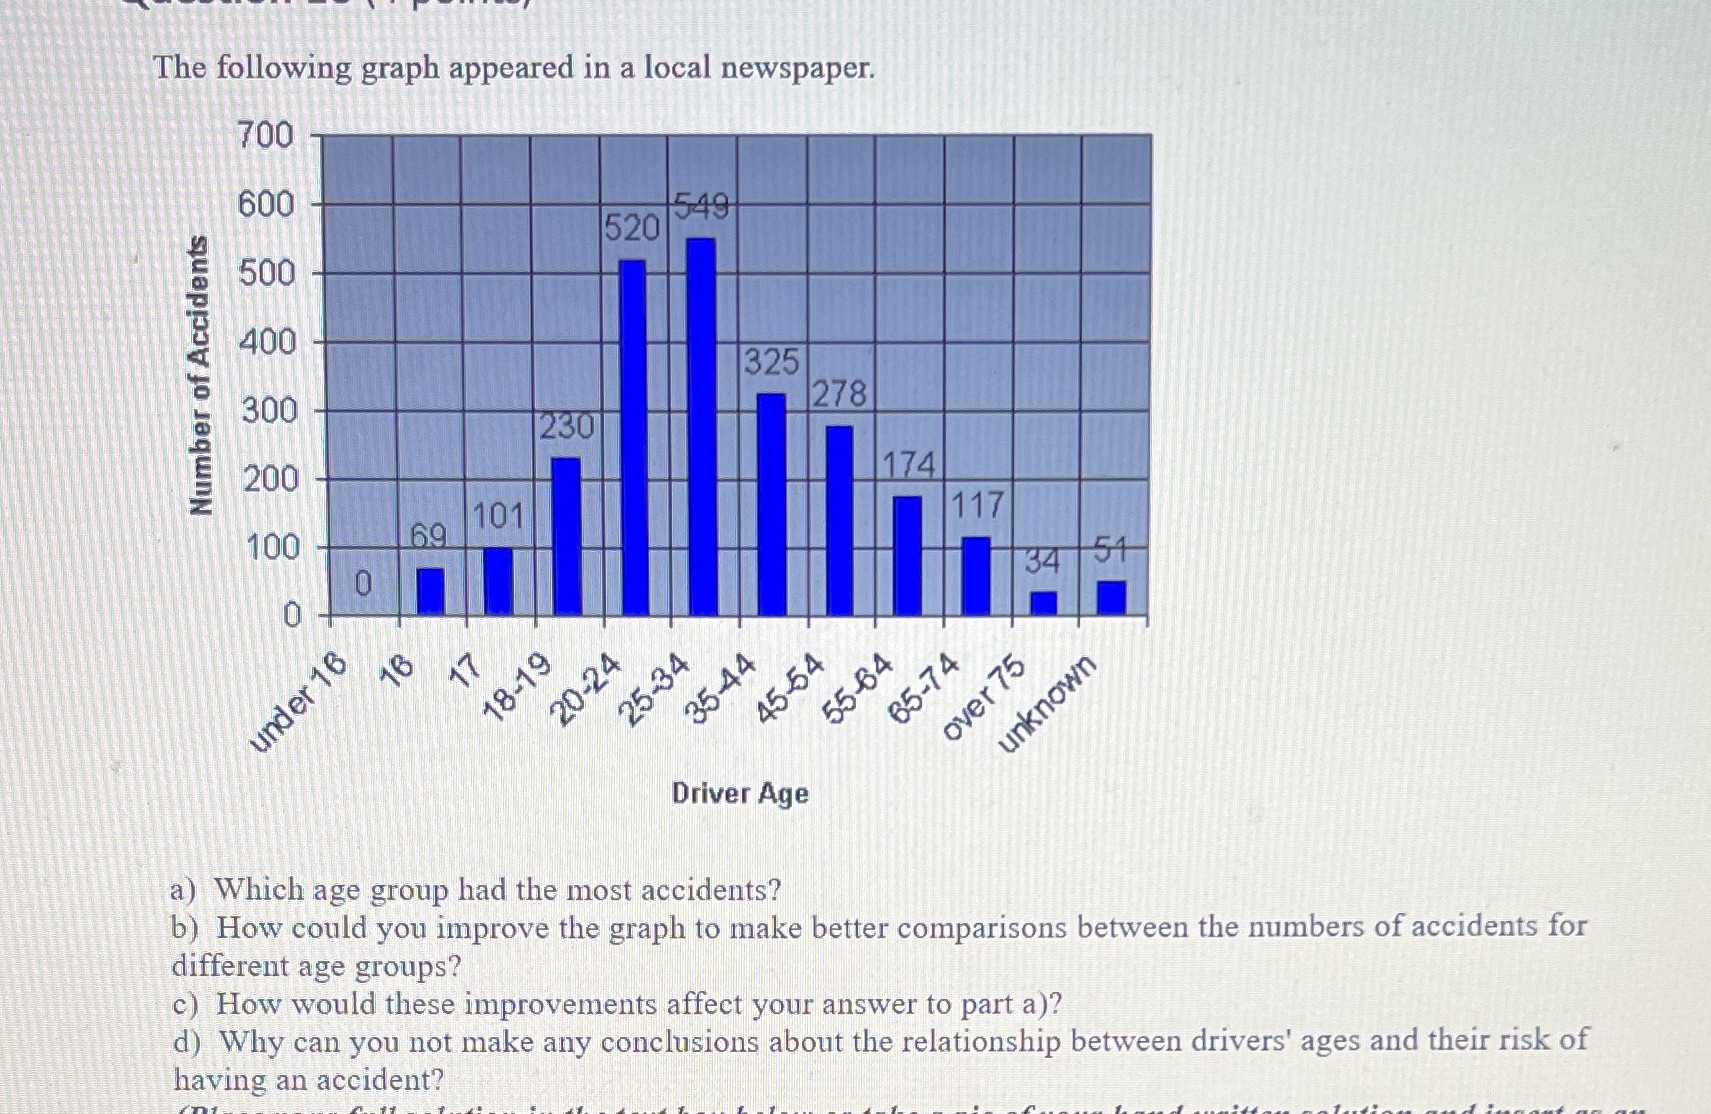
The following graph appeared in a local newspaper. 700 600 549 520 500 400 325 Number of Accidents 300 278 230 200 174 117 100 69 101 34 154 34 18-19 20-24 35-44 5-54 55-64 65-74 1 75 under 16 unknown OV Driver Age a) Which age group had the most accidents? b) How could you improve the graph to make better comparisons between the numbers of accidents for different age groups? c) How would these improvements affect your answer to part a)? d) Why can you not make any conclusions about the relationship between drivers' ages and their risk of having an accident
Step by Step Solution
There are 3 Steps involved in it

Get step-by-step solutions from verified subject matter experts