

Question: please show full work 3. The following table reports the mean and the standard deviation of returns for three assets. The riskless asset has a
please show full work
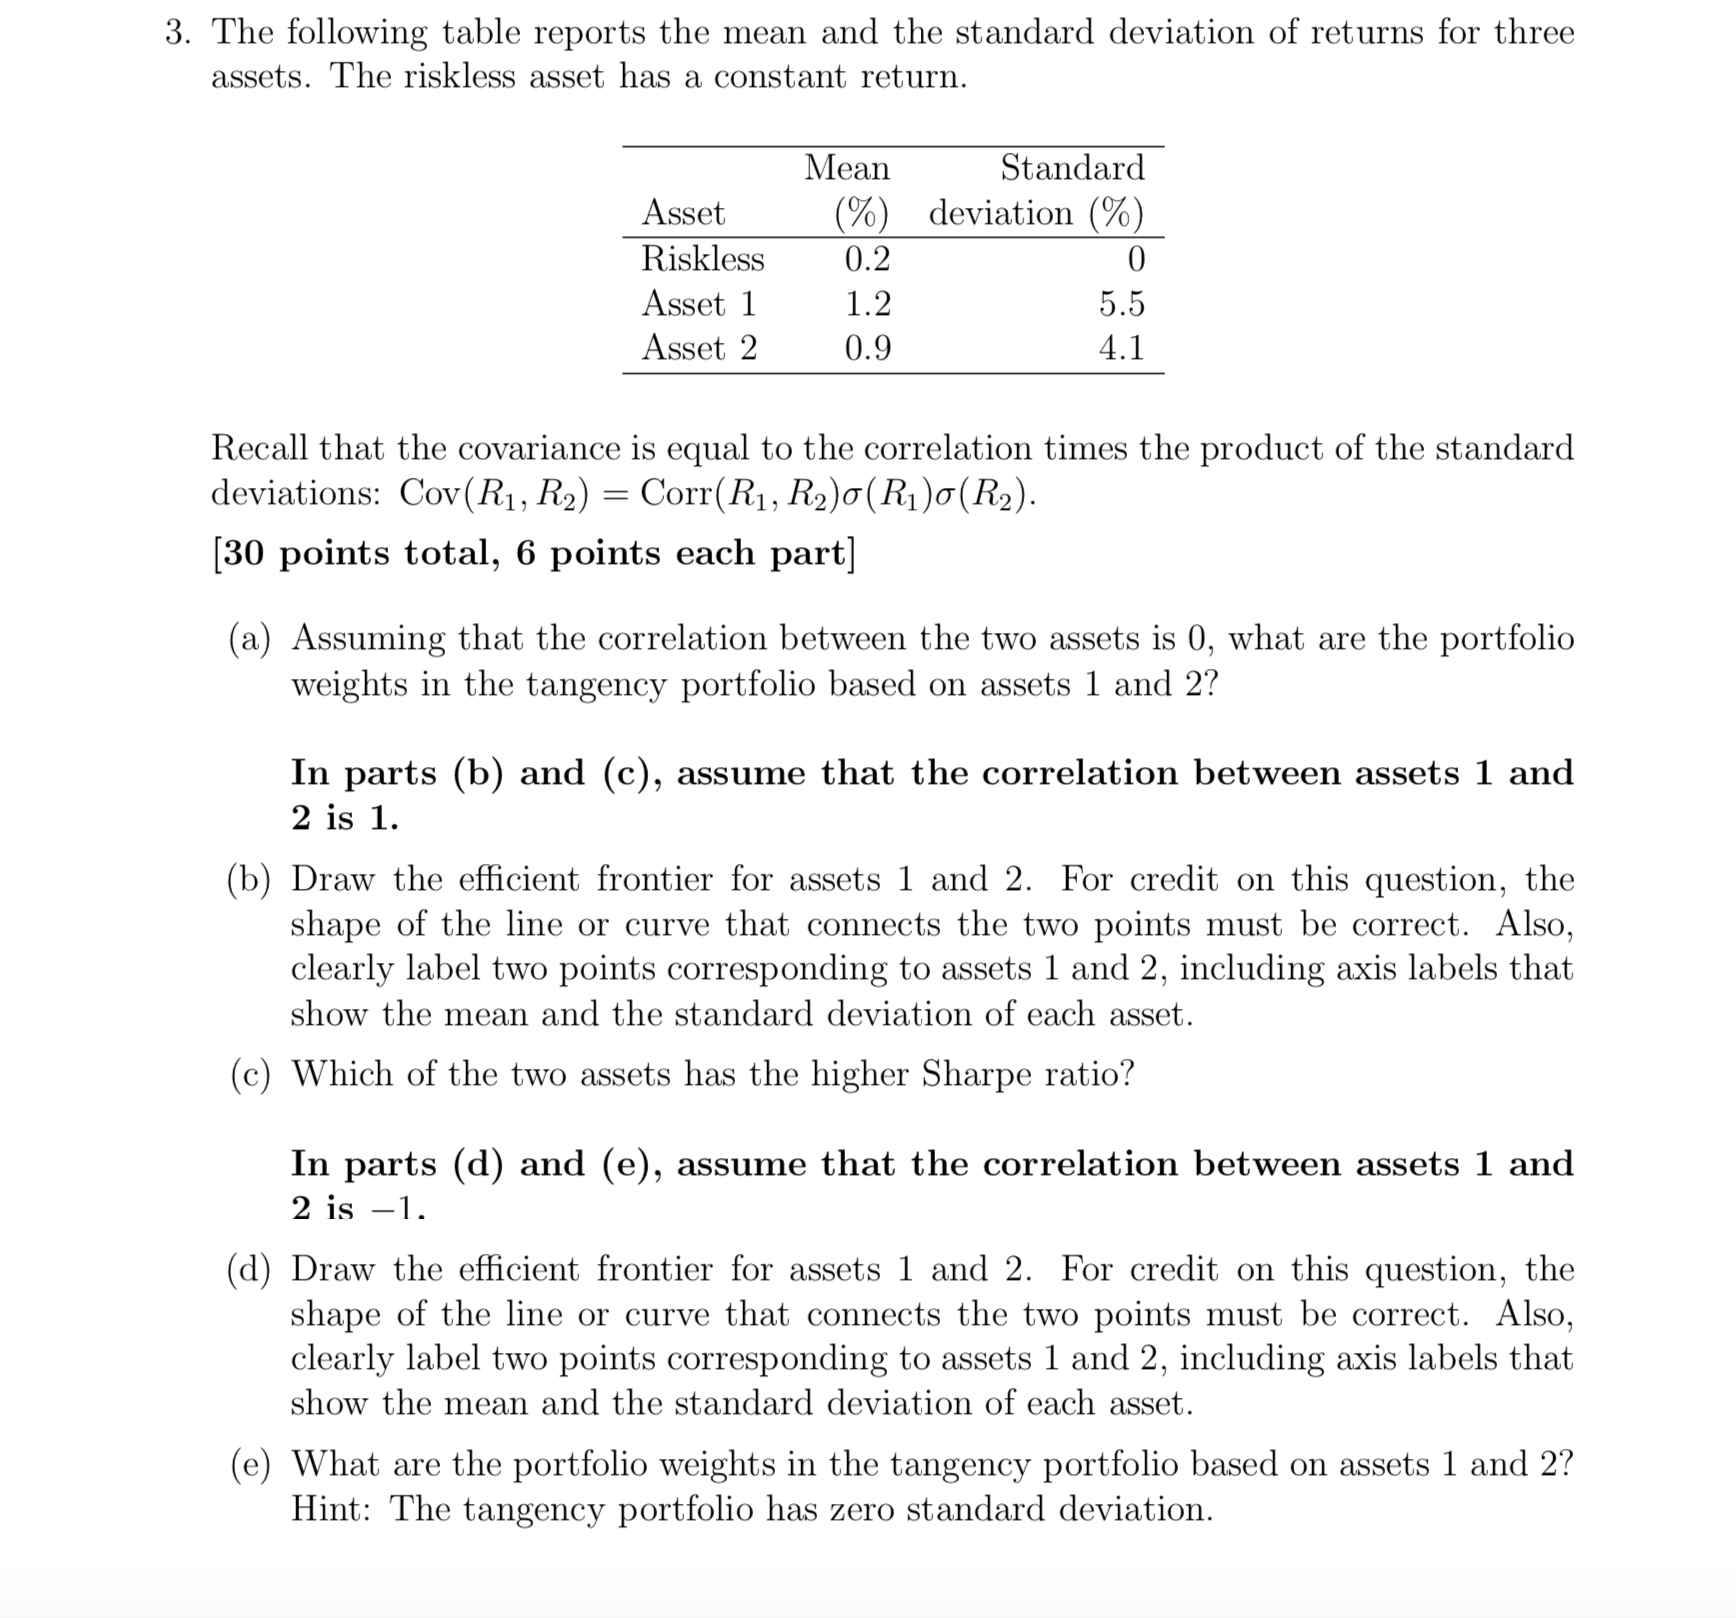
3. The following table reports the mean and the standard deviation of returns for three assets. The riskless asset has a constant return. Mean Standard Asset (%) deviation (%) Riskless 0.2 0 Asset 1 1.2 5.5 Asset 2 0.9 4.1 Recall that the covariance is equal to the correlation times the product of the standard deviations: Cov(R1,R2) = Corr(R1,R2)a(R1)a(R2). [30 points total, 6 points each part] (3) Assuming that the correlation between the two assets is 0, what are the portfolio weights in the tangency portfolio based on assets 1 and 2'? In parts (b) and (c), assume that the correlation between assets 1 and 2 is 1. Draw the eicient frontier for assets 1 and 2. For credit on this question, the shape of the line or curve that connects the two points must be correct. Also, clearly label two points correSponding to assets 1 and 2, including axis labels that show the mean and the standard deviation of each asset. Which of the two assets has the higher Sharpe ratio? In parts ((1) and (e), assume that the correlation between assets 1 and 2 is 1. Draw the eicient frontier for assets 1 and 2. For credit on this question, the shape of the line or curve that connects the two points must be correct. Also, clearly label two points correSponding to assets 1 and 2, including axis labels that show the mean and the standard deviation of each asset. What are the portfolio weights in the tangency portfolio based on assets 1 and 2'? Hint: The tangency portfolio has zero standard deviation
Step by Step Solution
There are 3 Steps involved in it

Get step-by-step solutions from verified subject matter experts