

Question: please show how the code is exactly inserted in matlab or a photo of the program Problem 2 . The power-law model (shown below) describes
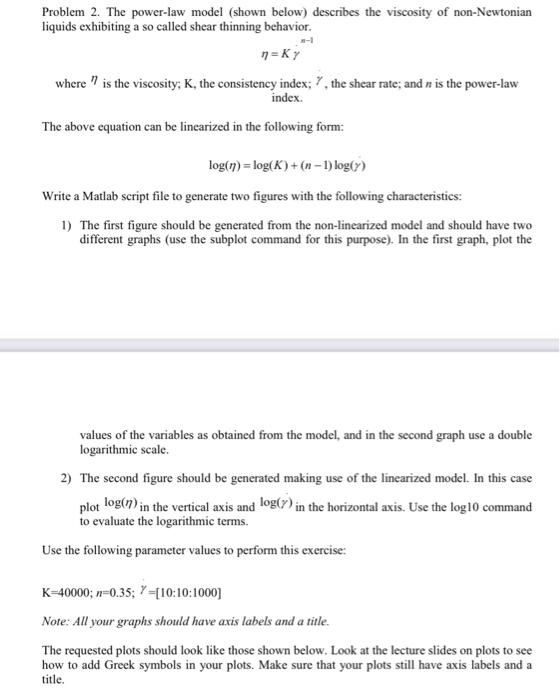
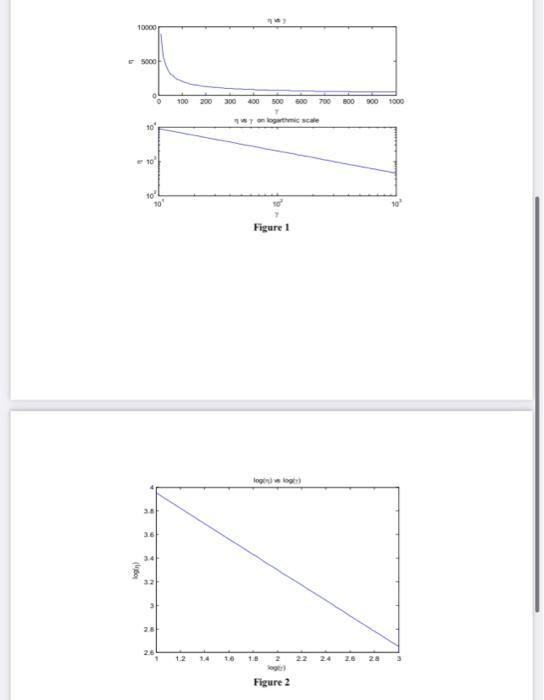
Problem 2 . The power-law model (shown below) describes the viscosity of non-Newtonian liquids exhibiting a so called shear thinning behavior. =Kn1 index. The above equation can be linearized in the following form: log()=log(K)+(n1)log() Write a Matlab script file to generate two figures with the following characteristics: 1) The first figure should be generated from the non-linearized model and should have two different graphs (use the subplot command for this purpose). In the first graph, plot the values of the variables as obtained from the model, and in the second graph use a double logarithmic scale. 2) The second figure should be generated making use of the linearized model. In this case plot log() in the vertical axis and log() in the horizontal axis. Use the log10 command to evaluate the logarithmic terms. Use the following parameter values to perform this exercise: K=40000;n=0.35;=[10:10:1000] Note: All your graphs should have axis labels and a title. The requested plots should look like those shown below. Look at the lecture slides on plots to see how to add Greek symbols in your plots. Make sure that your plots still have axis labels and a title. Figure 1 Figure 2
Step by Step Solution
There are 3 Steps involved in it

Get step-by-step solutions from verified subject matter experts