

Question: Please show how to solve in excel. Historically, the average proportion of defective bars has been 0.015. Samples will be of 100 bars each. Construct
Please show how to solve in excel.
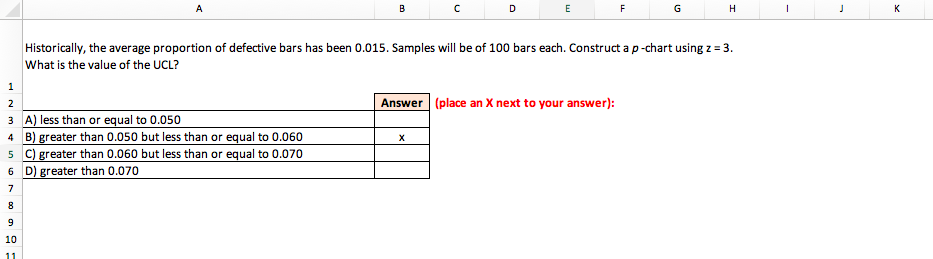
Historically, the average proportion of defective bars has been 0.015. Samples will be of 100 bars each. Construct a p-chart using z=3. What is the value of the UCLStep by Step Solution
There are 3 Steps involved in it
1 Expert Approved Answer
Step: 1 Unlock

Question Has Been Solved by an Expert!
Get step-by-step solutions from verified subject matter experts
Step: 2 Unlock
Step: 3 Unlock