

Question: Question 33 (3 points) Table 5.1 Size of Sample 2 3 4 5 6 Factors for Calculating ThreeSign Lits for the x Chartaal R.Chart Factor
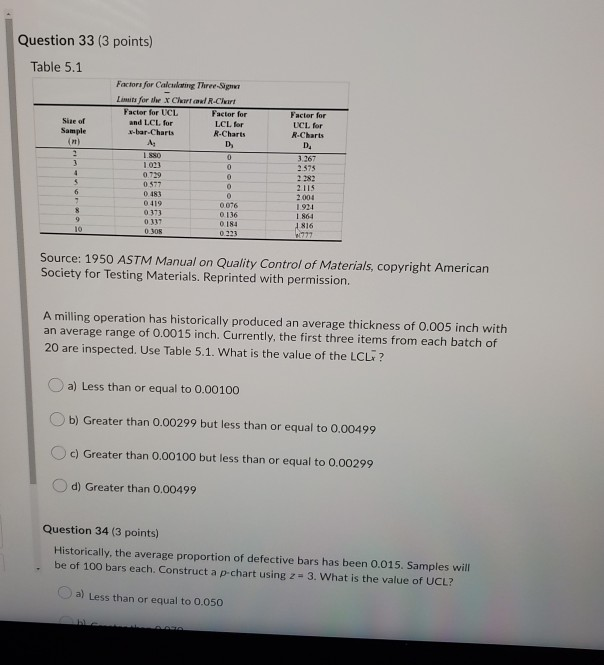
Question 33 (3 points) Table 5.1 Size of Sample 2 3 4 5 6 Factors for Calculating ThreeSign Lits for the x Chartaal R.Chart Factor for UCL Factor for and LCL for LCL for x-bar.Charts R-Charts A D 1.SND 0 1033 0.729 0 0577 0 0183 0 0.419 0076 0373 0136 0317 O 184 0.305 0.223 Factor for UCL for R.Charts D. 3 767 2.575 2282 2.115 2.001 1.924 1.86-1 1816 9 10 Source: 1950 ASTM Manual on Quality Control of Materials, copyright American Society for Testing Materials. Reprinted with permission. A milling operation has historically produced an average thickness of 0.005 inch with an average range of 0.0015 inch. Currently, the first three items from each batch of 20 are inspected. Use Table 5.1. What is the value of the LCLI? a) Less than or equal to 0.00100 b) Greater than 0.00299 but less than or equal to 0.00499 c) Greater than 0.00100 but less than or equal to 0.00299 d) Greater than 0.00499 Question 34 (3 points) Historically, the average proportion of defective bars has been 0.015. Samples will be of 100 bars each. Construct a p-chart using z = 3. What is the value of UCL? a) Less than or equal to 0.050
Step by Step Solution
There are 3 Steps involved in it
1 Expert Approved Answer
Step: 1 Unlock

Question Has Been Solved by an Expert!
Get step-by-step solutions from verified subject matter experts
Step: 2 Unlock
Step: 3 Unlock