

Question: please show how to solve this with steps. thank you 1 Quantitative Analysis This first exercise teaches you about some of the data that was
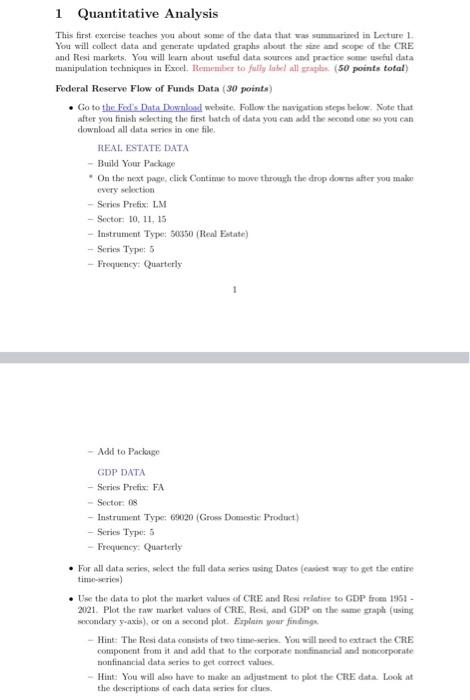
1 Quantitative Analysis This first exercise teaches you about some of the data that was sumed in Lecture 1 You will collect data and generate updated graplis about the size and scope of the CRE and Resi markets. You will learn about useful data sources and practice site useful data manipulation techniques in Excel. Remember to fully labd alles (50 points total) Federal Reserve Flow of Funds Data (30 points) . Go to the Fed's Data Download website. Follow the navigatie steps below. Note that after you finish selecting the first batch of data you can add the second so you can download all data series in one file. REAL ESTATE DATA - Build Your Package On the next page. Click Continue to move through the drop dowes after you maker every selection - Series Pretix: LM - Sector 10, 11, 15 Instrument Type: $850 (Real Estate) -Series Type: 5 - Fretency: Quarterly 1 Add to Package GDP DATA - Series Prefix: FA - Sector os - Instrument Type: 69020 (Gross Domestic Product -Series Type: 5 - Frequency: Quarterly . For all data series, wlect the full data series using Dates (coot ww to get the entire time-series) Use the data to plot the market values of CRE and Resi relative to GDP from 1961 2021. Plot the raw marion values of CRE, Resi, and GDP on the same gruplatsing daty -axis), or on a second plot. Explain your finding Hint: The Resi data omists of two tittelen. You will need to extract the CRE component from it and add that to the corporate non financial and not corporate toninancial data series to get correct value Hint: You will also have to make an adjustment to plot the CRE data Look at the descriptions of each data for curs, 1 Quantitative Analysis This first exercise teaches you about some of the data that was sumed in Lecture 1 You will collect data and generate updated graplis about the size and scope of the CRE and Resi markets. You will learn about useful data sources and practice site useful data manipulation techniques in Excel. Remember to fully labd alles (50 points total) Federal Reserve Flow of Funds Data (30 points) . Go to the Fed's Data Download website. Follow the navigatie steps below. Note that after you finish selecting the first batch of data you can add the second so you can download all data series in one file. REAL ESTATE DATA - Build Your Package On the next page. Click Continue to move through the drop dowes after you maker every selection - Series Pretix: LM - Sector 10, 11, 15 Instrument Type: $850 (Real Estate) -Series Type: 5 - Fretency: Quarterly 1 Add to Package GDP DATA - Series Prefix: FA - Sector os - Instrument Type: 69020 (Gross Domestic Product -Series Type: 5 - Frequency: Quarterly . For all data series, wlect the full data series using Dates (coot ww to get the entire time-series) Use the data to plot the market values of CRE and Resi relative to GDP from 1961 2021. Plot the raw marion values of CRE, Resi, and GDP on the same gruplatsing daty -axis), or on a second plot. Explain your finding Hint: The Resi data omists of two tittelen. You will need to extract the CRE component from it and add that to the corporate non financial and not corporate toninancial data series to get correct value Hint: You will also have to make an adjustment to plot the CRE data Look at the descriptions of each data for curs
Step by Step Solution
There are 3 Steps involved in it

Get step-by-step solutions from verified subject matter experts