

Question: Total Points: 160 points 1 Quantitative Analysis This first exercise teaches you about some of the data that was summarized in Lecture 1. You will
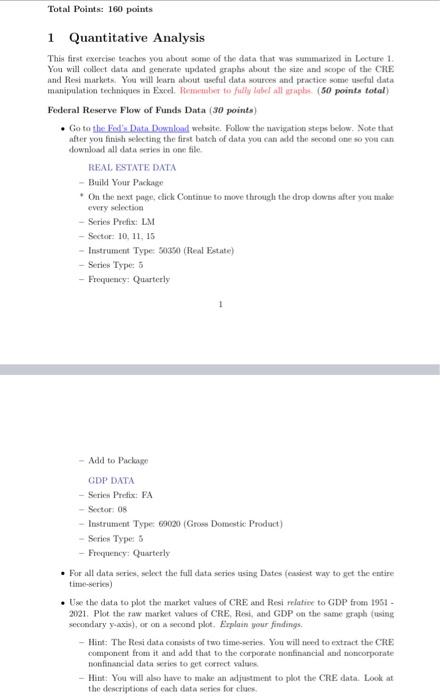
Total Points: 160 points 1 Quantitative Analysis This first exercise teaches you about some of the data that was summarized in Lecture 1. You will collect data and generate updated graphs about the size and scope of the CRE and Resi markets. You will learn about useful data sources and practice some useful data manipulation techniques in Excel. Remember to fully label all sorphs (50 points total) Federal Reserve Flow of Funds Data (30 points) . Go to the Fed's Data Download website. Follow the navigation steps below. Note that after you finish selecting the first batch of data you can add the second one so you can download all data series in one file REAL ESTATE DATA - Build Your Package . On the next page, click Continue to me through the drop downs after you make every selection -Series Preis: LM - Sector: 10, 11.15 - Instrument Type: 30350 (Real Estate) - Series Type: - Frequency: Quarterly - Add to Palopo GDP DATA -Series Preix: FA - Sector: 0 Instrument Type 69020 (Gross Domestic Product) - Series Type 8 Frequency: Quarterly . For all data series, select the full data series using Dates (causiest way to get the entire time-series) Use the data to plot the market values of CRE and Resi relative to GDP from 1951 - 2021. Plot the raw market values of CRE, Resi, and GDP on the same graph (using secondary y-axis), or on second palet. Erplain your findings: - Hint: The Resi data consists of two time series. You will need to extract the CRE component from it and add that to the corporate nofinancial and corporate non financial data were to get correct sala - Hitat: You will also have to make an adjustment to plot the CRE data. Look at the descriptions of each data series for clues Total Points: 160 points 1 Quantitative Analysis This first exercise teaches you about some of the data that was summarized in Lecture 1. You will collect data and generate updated graphs about the size and scope of the CRE and Resi markets. You will learn about useful data sources and practice some useful data manipulation techniques in Excel. Remember to fully label all sorphs (50 points total) Federal Reserve Flow of Funds Data (30 points) . Go to the Fed's Data Download website. Follow the navigation steps below. Note that after you finish selecting the first batch of data you can add the second one so you can download all data series in one file REAL ESTATE DATA - Build Your Package . On the next page, click Continue to me through the drop downs after you make every selection -Series Preis: LM - Sector: 10, 11.15 - Instrument Type: 30350 (Real Estate) - Series Type: - Frequency: Quarterly - Add to Palopo GDP DATA -Series Preix: FA - Sector: 0 Instrument Type 69020 (Gross Domestic Product) - Series Type 8 Frequency: Quarterly . For all data series, select the full data series using Dates (causiest way to get the entire time-series) Use the data to plot the market values of CRE and Resi relative to GDP from 1951 - 2021. Plot the raw market values of CRE, Resi, and GDP on the same graph (using secondary y-axis), or on second palet. Erplain your findings: - Hint: The Resi data consists of two time series. You will need to extract the CRE component from it and add that to the corporate nofinancial and corporate non financial data were to get correct sala - Hitat: You will also have to make an adjustment to plot the CRE data. Look at the descriptions of each data series for clues
Step by Step Solution
There are 3 Steps involved in it

Get step-by-step solutions from verified subject matter experts