

Question: PLEASE SHOW HOW TO SOLVE USING EXCEL, PLEASE INCLUDE ALL FORMULAS USING FOR EXAMPLE: =PV(C42,C41.C40,0,0) A5 ='Income Statement'!E4 A B D E F G H
PLEASE SHOW HOW TO SOLVE USING EXCEL, PLEASE INCLUDE ALL FORMULAS USING FOR EXAMPLE: =PV(C42,C41.C40,0,0)
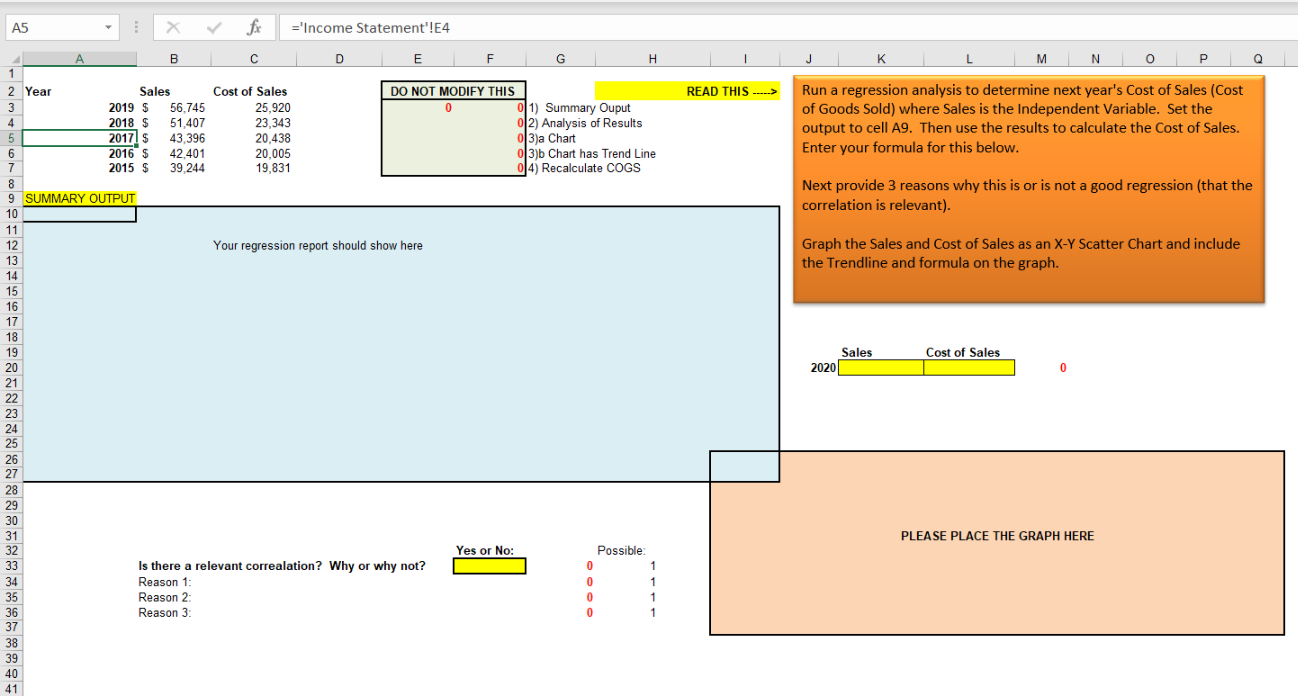
A5 ='Income Statement'!E4 A B D E F G H M N 0 Q 1 READ THIS --> Run a regression analysis to determine next year's Cost of Sales (Cost of Goods Sold) where Sales is the Independent Variable. Set the output to cell A9. Then use the results to calculate the cost of Sales. Enter your formula for this below. Next provide 3 reasons why this is or is not a good regression (that the correlation is relevant). Graph the Sales and Cost of Sales as an X-Y Scatter Chart and include the Trendline and formula on the graph. Sales Cost of Sales 2020 0 2 Year Sales Cost of Sales DO NOT MODIFY THIS 3 2019 $ 56,745 25.920 0 1) Summary Ouput 4 2018 $ 51.407 23.343 012) Analysis of Results 5 20171 $ 43.396 20.438 03)a Chart 6 2016 $ 42.401 20.005 0|3)b Chart has Trend Line 7 2015 $ 39,244 19,831 14) Recalculate COGS 8 9 SUMMARY OUTPUT 10 11 12 Your regression report should show here 13 14 15 16 17 18 19 20 21 22 23 24 25 26 27 28 29 30 31 32 Yes or No: Possible: 33 Is there a relevant correalation? Why or why not? 0 1 34 Reason 1: 0 35 Reason 2 0 36 Reason 3 0 1 37 38 39 40 41 PLEASE PLACE THE GRAPH HERE 1 1 A5 ='Income Statement'!E4 A B D E F G H M N 0 Q 1 READ THIS --> Run a regression analysis to determine next year's Cost of Sales (Cost of Goods Sold) where Sales is the Independent Variable. Set the output to cell A9. Then use the results to calculate the cost of Sales. Enter your formula for this below. Next provide 3 reasons why this is or is not a good regression (that the correlation is relevant). Graph the Sales and Cost of Sales as an X-Y Scatter Chart and include the Trendline and formula on the graph. Sales Cost of Sales 2020 0 2 Year Sales Cost of Sales DO NOT MODIFY THIS 3 2019 $ 56,745 25.920 0 1) Summary Ouput 4 2018 $ 51.407 23.343 012) Analysis of Results 5 20171 $ 43.396 20.438 03)a Chart 6 2016 $ 42.401 20.005 0|3)b Chart has Trend Line 7 2015 $ 39,244 19,831 14) Recalculate COGS 8 9 SUMMARY OUTPUT 10 11 12 Your regression report should show here 13 14 15 16 17 18 19 20 21 22 23 24 25 26 27 28 29 30 31 32 Yes or No: Possible: 33 Is there a relevant correalation? Why or why not? 0 1 34 Reason 1: 0 35 Reason 2 0 36 Reason 3 0 1 37 38 39 40 41 PLEASE PLACE THE GRAPH HERE 1 1
Step by Step Solution
There are 3 Steps involved in it
To solve this regression analysis problem in Excel you will need to run a regression using the builtin Analysis ToolPak and then use the results to calculate the cost of sales Cost of Goods Sold for t... View full answer

Get step-by-step solutions from verified subject matter experts