

Question: PLEASE SHOW HOW TO SOLVE USING EXCEL, PLEASE INCLUDE ALL FORMULAS USING FOR EXAMPLE: =PV(C42,C41.C40,0,0) A5 fx Sales A B D F F G H
PLEASE SHOW HOW TO SOLVE USING EXCEL, PLEASE INCLUDE ALL FORMULAS USING FOR EXAMPLE: =PV(C42,C41.C40,0,0)
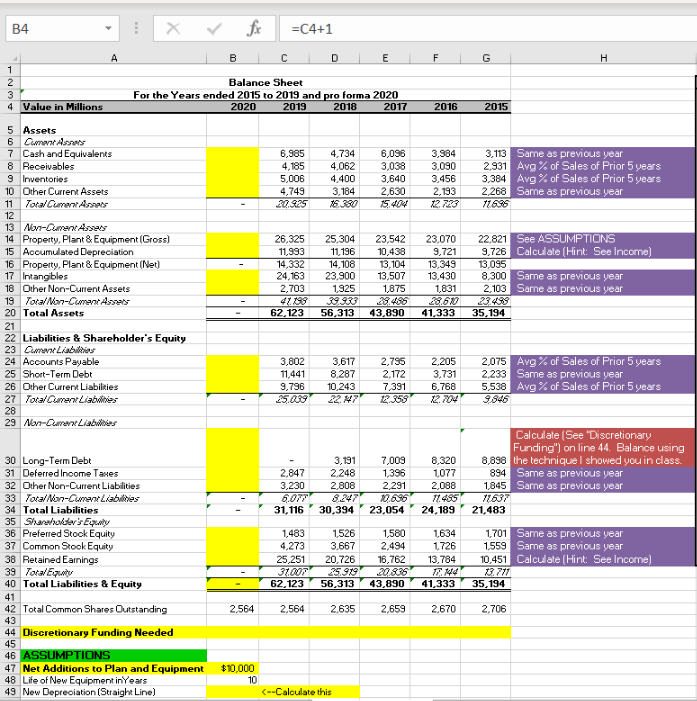
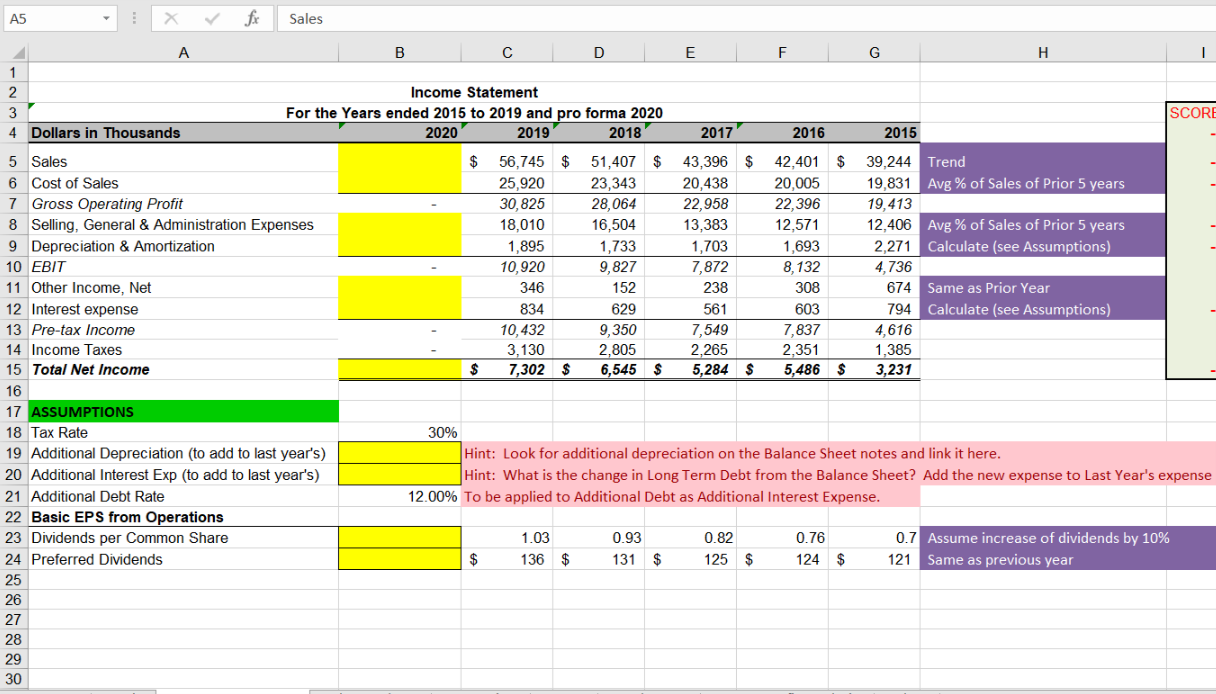
A5 fx Sales A B D F F G H 1 1 2 3 4 Dollars in Thousands Income Statement For the Years ended 2015 to 2019 and pro forma 2020 2020 2019 2018 SCORE 2017 2016 2015 $ 56,745 $ 25,920 30,825 18,010 1,895 10,920 346 834 10,432 3,130 7,302 $ 51,407 $ 23,343 28,064 16,504 1,733 9,827 152 629 9,350 2,805 6,545 $ 43.396 $ 20,438 22,958 13,383 1,703 7,872 238 561 7,549 2,265 5,284 $ 42,401 $ 20,005 22,396 12,571 1,693 8,132 308 603 7,837 2.351 5,486 $ 39,244 Trend 19,831 Avg % of Sales of Prior 5 years 19,413 12,406 Avg % of Sales of Prior 5 years 2,271 Calculate (see Assumptions) 4,736 674 Same as Prior Year 794 Calculate (see Assumptions) 4,616 1,385 3,231 $ 5 Sales 6 Cost of Sales 7 Gross Operating Profit 8 Selling, General & Administration Expenses 9 Depreciation & Amortization 10 EBIT 11 Other Income, Net 12 Interest expense 13 Pre-tax Income 14 Income Taxes 15 Total Net Income 16 17 ASSUMPTIONS 18 Tax Rate 19 Additional Depreciation (to add to last year's) 20 Additional Interest Exp (to add to last year's) 21 Additional Debt Rate 22 Basic EPS from Operations 23 Dividends per Common Share 24 Preferred Dividends 25 26 27 28 29 30 30% Hint: Look for additional depreciation on the Balance Sheet notes and link it here. Hint: What is the change in Long Term Debt from the Balance Sheet? Add the new expense to Last Year's expense 12.00% To be applied to Additional Debt as Additional Interest Expense. 1.03 136 $ 0.93 131 $ 0.82 125 $ 0.76 124 $ 0.7 Assume increase of dividends by 10% 121 Same as previous year $ A5 fx Sales A B D F F G H 1 1 2 3 4 Dollars in Thousands Income Statement For the Years ended 2015 to 2019 and pro forma 2020 2020 2019 2018 SCORE 2017 2016 2015 $ 56,745 $ 25,920 30,825 18,010 1,895 10,920 346 834 10,432 3,130 7,302 $ 51,407 $ 23,343 28,064 16,504 1,733 9,827 152 629 9,350 2,805 6,545 $ 43.396 $ 20,438 22,958 13,383 1,703 7,872 238 561 7,549 2,265 5,284 $ 42,401 $ 20,005 22,396 12,571 1,693 8,132 308 603 7,837 2.351 5,486 $ 39,244 Trend 19,831 Avg % of Sales of Prior 5 years 19,413 12,406 Avg % of Sales of Prior 5 years 2,271 Calculate (see Assumptions) 4,736 674 Same as Prior Year 794 Calculate (see Assumptions) 4,616 1,385 3,231 $ 5 Sales 6 Cost of Sales 7 Gross Operating Profit 8 Selling, General & Administration Expenses 9 Depreciation & Amortization 10 EBIT 11 Other Income, Net 12 Interest expense 13 Pre-tax Income 14 Income Taxes 15 Total Net Income 16 17 ASSUMPTIONS 18 Tax Rate 19 Additional Depreciation (to add to last year's) 20 Additional Interest Exp (to add to last year's) 21 Additional Debt Rate 22 Basic EPS from Operations 23 Dividends per Common Share 24 Preferred Dividends 25 26 27 28 29 30 30% Hint: Look for additional depreciation on the Balance Sheet notes and link it here. Hint: What is the change in Long Term Debt from the Balance Sheet? Add the new expense to Last Year's expense 12.00% To be applied to Additional Debt as Additional Interest Expense. 1.03 136 $ 0.93 131 $ 0.82 125 $ 0.76 124 $ 0.7 Assume increase of dividends by 10% 121 Same as previous year $
Step by Step Solution
There are 3 Steps involved in it

Get step-by-step solutions from verified subject matter experts