

Question: Please show how values are obtained from Matlab plot good answers always upvote thank you Compute the Bode diagram of G(s) (see the command bode
Please show how values are obtained from Matlab plot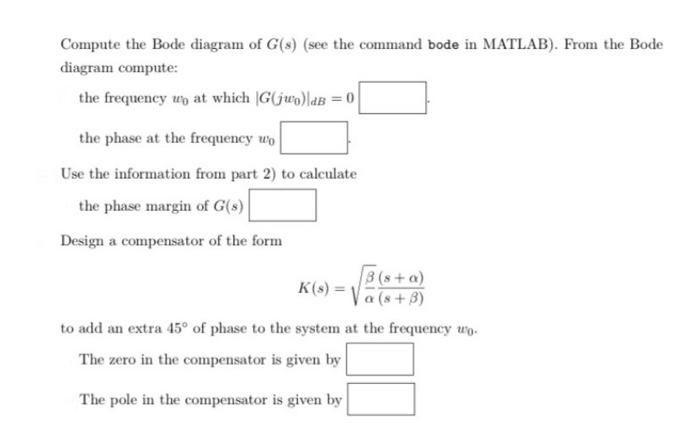
good answers always upvote thank you
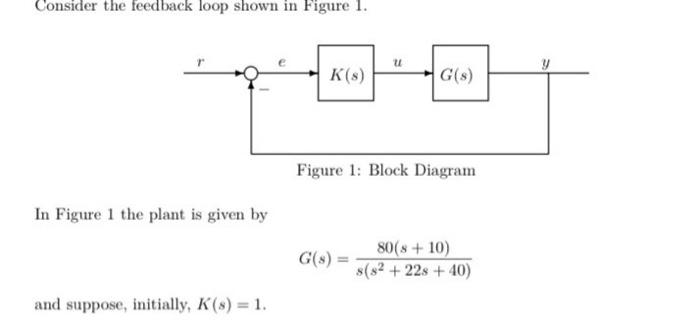
Compute the Bode diagram of G(s) (see the command bode in MATLAB). From the Bode diagram compute: the frequency w0 at which G(jw0)dB=0 the phase at the frequency w0 Use the information from part 2) to calculate the phase margin of G(s) Design a compensator of the form K(s)=(s+)(s+) to add an extra 45 of phase to the system at the frequency w0. The zero in the compensator is given by The pole in the compensator is given by Consider the feedback loop shown in Figure 1. Figure 1: Block Dlagram In Figure 1 the plant is given by G(s)=s(s2+22s+40)80(s+10) and suppose, initially, K(s)=1
Step by Step Solution
There are 3 Steps involved in it
1 Expert Approved Answer
Step: 1 Unlock

Question Has Been Solved by an Expert!
Get step-by-step solutions from verified subject matter experts
Step: 2 Unlock
Step: 3 Unlock