

Question: Please show how you got your answer so I can understand Problem 11 - The table and diagram below provide information related to a hypothetical
Please show how you got your answer so I can understand
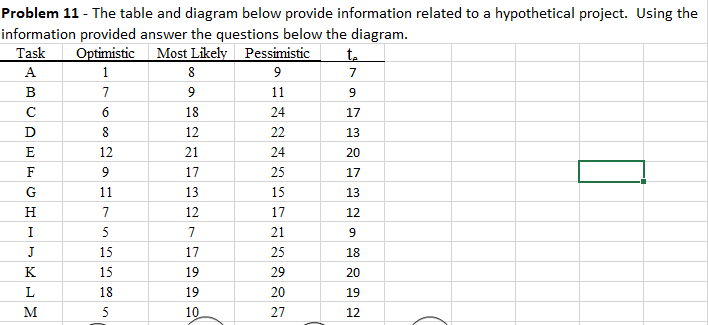
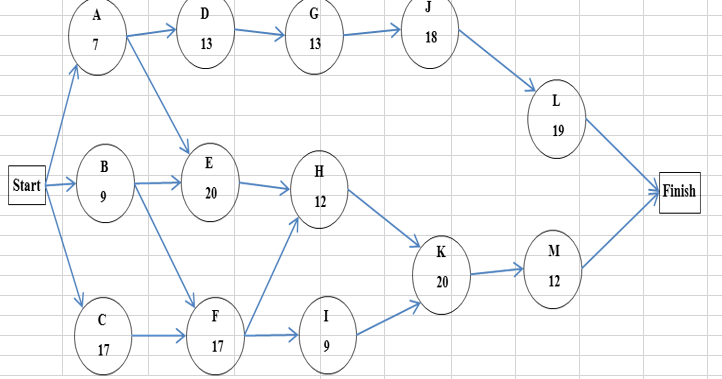
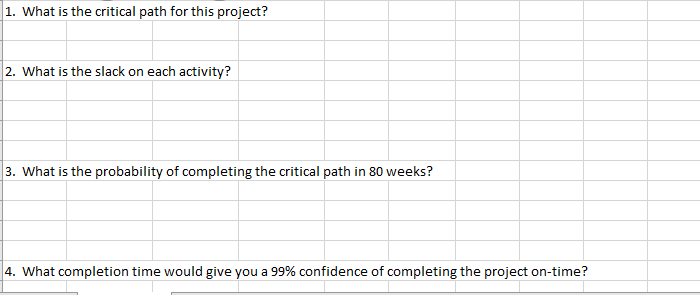
Problem 11 - The table and diagram below provide information related to a hypothetical project. Using the information provided answer the questions below the diagram. Task Optimistic Most Likely Pessimistic t. 7 B 11 6 8 12 9 18 12 21 22 17 1113 7 12 5 17 18 A K 1. What is the critical path for this project? 2. What is the slack on each activity? 3. What is the probability of completing the critical path in 80 weeks? 4. What completion time would give you a 99% confidence of completing the project on-timeStep by Step Solution
There are 3 Steps involved in it
1 Expert Approved Answer
Step: 1 Unlock

Question Has Been Solved by an Expert!
Get step-by-step solutions from verified subject matter experts
Step: 2 Unlock
Step: 3 Unlock