

Question: Please show in excel! 2. Consider the data in problem 2 and perform a scenario analysis using the percentages of change for the same uncertain
 Please show in excel!
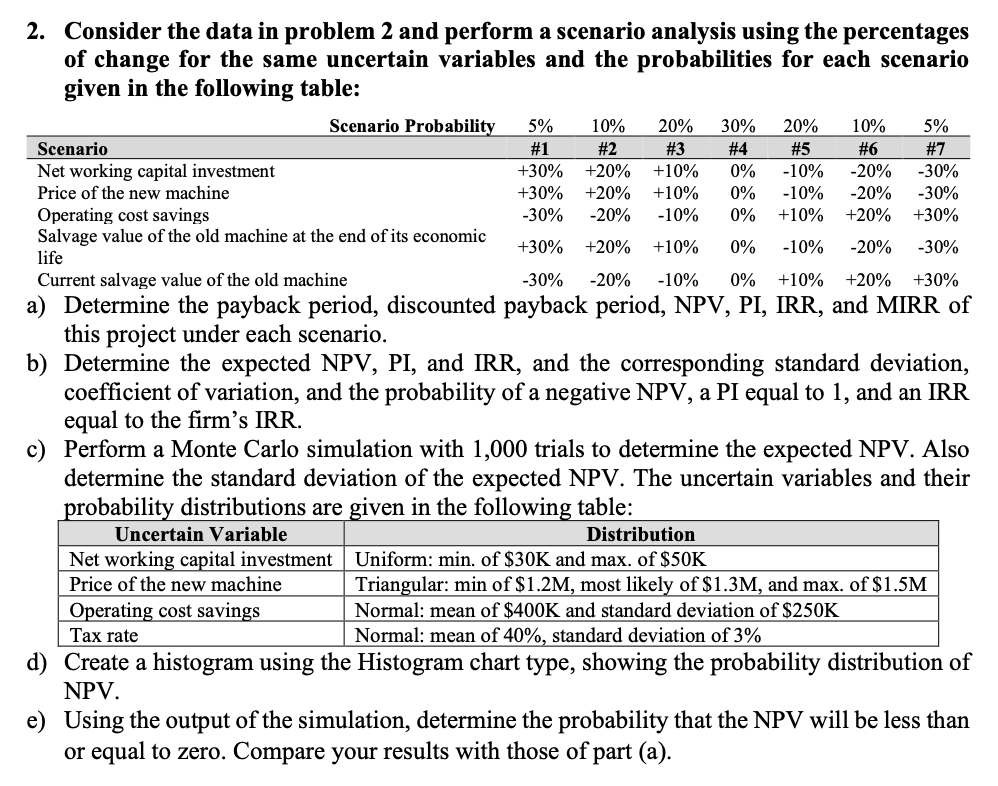
2. Consider the data in problem 2 and perform a scenario analysis using the percentages of change for the same uncertain variables and the probabilities for each scenario given in the following table: a) Determine the payback period, discounted payback period, NPV, PI, IRR, and MIRR of this project under each scenario. b) Determine the expected NPV, PI, and IRR, and the corresponding standard deviation, coefficient of variation, and the probability of a negative NPV, a PI equal to 1 , and an IRR equal to the firm's IRR. c) Perform a Monte Carlo simulation with 1,000 trials to determine the expected NPV. Also determine the standard deviation of the expected NPV. The uncertain variables and their probability distributions are given in the following table: d) Create a histogram using the Histogram chart type, showing the probability distribution of NPV. e) Using the output of the simulation, determine the probability that the NPV will be less than or equal to zero. Compare your results with those of part (a). 2. Consider the data in problem 2 and perform a scenario analysis using the percentages of change for the same uncertain variables and the probabilities for each scenario given in the following table: a) Determine the payback period, discounted payback period, NPV, PI, IRR, and MIRR of this project under each scenario. b) Determine the expected NPV, PI, and IRR, and the corresponding standard deviation, coefficient of variation, and the probability of a negative NPV, a PI equal to 1 , and an IRR equal to the firm's IRR. c) Perform a Monte Carlo simulation with 1,000 trials to determine the expected NPV. Also determine the standard deviation of the expected NPV. The uncertain variables and their probability distributions are given in the following table: d) Create a histogram using the Histogram chart type, showing the probability distribution of NPV. e) Using the output of the simulation, determine the probability that the NPV will be less than or equal to zero. Compare your results with those of part (a)
Step by Step Solution
There are 3 Steps involved in it

Get step-by-step solutions from verified subject matter experts