

Question: (please show in Microsoft Excel) A) Study height data using descriptive statistics (e.g. mean, median, standard deviation, range etc.) and visualization methods (e.g. histogram, polygon).
(please show in Microsoft Excel)
A) Study height data using descriptive statistics (e.g. mean, median, standard deviation, range etc.) and visualization methods (e.g. histogram, polygon). Note down any anomalies, outliers, or extreme skews or multi-modalities in your distributions that you can identify using these methods. Calculate the upper and lower bounds for the percentage of data contained in 1s, 2s, 3s to check if the data is normal or not. (For this question you can try various methods that you have learned in the class to give a detailed descriptive analysis).
B) Construct a polygon for weight based on the gender of respondents. Describe differences or similarities that you see in the polygon for males and females. Describe the distribution of weight for males and females. Are they more or less symmetric? Or are they skewed?
C) Make a scatter plot to comment on the relationship between height and weight data.
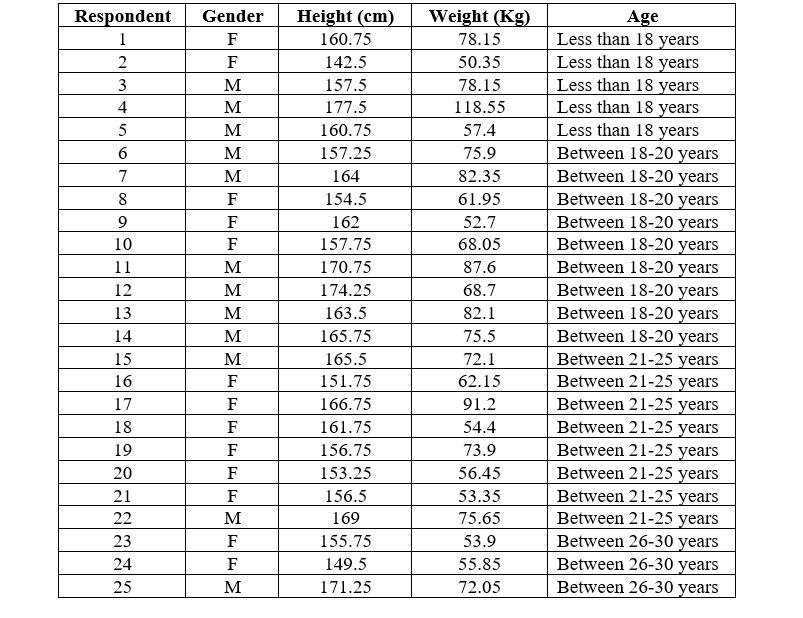
Respondent 1 2 3 4 5 6 7 8 9 10 11 12 Gender F F M M M M M F F F M M M M M F F F F F F M F F M Height (cm) 160.75 142.5 157.5 177.5 160.75 157.25 164 154.5 162 157.75 170.75 174.25 163.5 165.75 165.5 151.75 166.75 161.75 156.75 153.25 156.5 169 155.75 149.5 171.25 Weight (Kg) 78.15 50.35 78.15 118.55 57.4 75.9 82.35 61.95 52.7 68.05 87.6 68.7 82.1 75.5 72.1 62.15 91.2 54.4 73.9 56.45 53.35 75.65 53.9 55.85 72.05 Age Less than 18 years Less than 18 years Less than 18 years Less than 18 years Less than 18 years Between 18-20 years Between 18-20 years Between 18-20 years Between 18-20 years Between 18-20 years Between 18-20 years Between 18-20 years Between 18-20 years Between 18-20 years Between 21-25 years Between 21-25 years Between 21-25 years Between 21-25 years Between 21-25 years Between 21-25 years Between 21-25 years Between 21-25 years Between 26-30 years Between 26-30 years Between 26-30 years 13 14 15 16 17 18 19 20 21 22 23 24 25 Respondent 1 2 3 4 5 6 7 8 9 10 11 12 Gender F F M M M M M F F F M M M M M F F F F F F M F F M Height (cm) 160.75 142.5 157.5 177.5 160.75 157.25 164 154.5 162 157.75 170.75 174.25 163.5 165.75 165.5 151.75 166.75 161.75 156.75 153.25 156.5 169 155.75 149.5 171.25 Weight (Kg) 78.15 50.35 78.15 118.55 57.4 75.9 82.35 61.95 52.7 68.05 87.6 68.7 82.1 75.5 72.1 62.15 91.2 54.4 73.9 56.45 53.35 75.65 53.9 55.85 72.05 Age Less than 18 years Less than 18 years Less than 18 years Less than 18 years Less than 18 years Between 18-20 years Between 18-20 years Between 18-20 years Between 18-20 years Between 18-20 years Between 18-20 years Between 18-20 years Between 18-20 years Between 18-20 years Between 21-25 years Between 21-25 years Between 21-25 years Between 21-25 years Between 21-25 years Between 21-25 years Between 21-25 years Between 21-25 years Between 26-30 years Between 26-30 years Between 26-30 years 13 14 15 16 17 18 19 20 21 22 23 24 25
Step by Step Solution
There are 3 Steps involved in it

Get step-by-step solutions from verified subject matter experts